Information
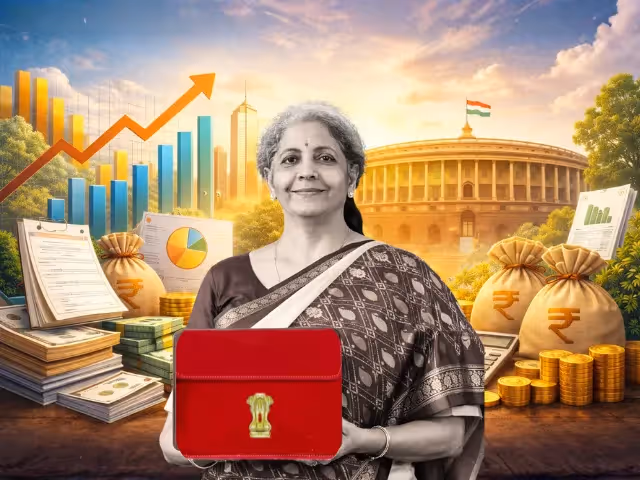

Budget 2026 Key Takeaways: Simplifying Nirmala Sitharaman’s Budget Speech
.webp)

TL;DR Summary
- Fiscal deficit stays on a consolidation path at 4.3 percent for FY27
- Record capital expenditure of ₹12.2 lakh crore boosts infra and manufacturing
- Strong push for AI, digital infrastructure, MSMEs and skilling
- Mixed short-term market reaction, positive long-term equity outlook
- Infrastructure, capital goods, manufacturing and IT remain key themes
Union Budget 2026 Explained: Key Announcements from Nirmala Sitharaman’s Speech and What They Mean
Introduction
Union Finance Minister Nirmala Sitharaman presented the Union Budget 2026 with a clear focus on fiscal discipline, growth-led capital expenditure, technology-driven development and inclusive progress. Amid global economic uncertainty, geopolitical risks and volatile financial markets, the Budget strikes a balance between prudence and ambition.
Union Budget 2026 is positioned as a continuation of India’s long-term reform journey, laying the groundwork for sustainable growth and the vision of Viksit Bharat by 2047. This blog breaks down the most important announcements, sector-wise implications and the impact on Indian stock markets.
Fiscal Deficit and Government Finances
Fiscal consolidation remains a core theme of Budget 2026.
The government has projected the fiscal deficit for FY27 at 4.3 percent of GDP, improving from an estimated 4.4 percent in FY26. This signals a steady move towards macroeconomic stability without sacrificing growth momentum.
Additionally, the Centre expects dividends and surplus worth ₹3.16 lakh crore from the RBI, public sector banks and financial institutions. This provides comfort on revenue visibility and reduces pressure on excessive borrowing.
From a market perspective, fiscal discipline improves India’s sovereign credibility and supports long-term equity valuations.
Record Capital Expenditure Push
Capital expenditure continues to be the backbone of the Budget.
Public capex has been raised to ₹12.2 lakh crore for FY27, accounting for 4.4 percent of GDP, the highest level ever. Including grants and support to states, effective capital expenditure stands at around ₹17.14 lakh crore.
This sustained investment is expected to create a multiplier effect across sectors, supporting job creation, demand revival and private sector investment. Historically, higher government capex has directly benefited capital goods, infrastructure and PSU-linked stocks.
Infrastructure and Railways Remain Growth Engines
Infrastructure once again takes centre stage in Budget 2026.
Railways received a capital allocation of ₹2.77 lakh crore, the highest ever, with focus on new lines, rolling stock, freight corridors and passenger capacity expansion. Continued emphasis on national highways, waterways and high-speed rail corridors strengthens logistics efficiency.
For investors, infrastructure visibility improves order books for EPC companies, logistics players, cement manufacturers and engineering firms. The focus on tier two and tier three cities also supports real estate, warehousing and consumption-led themes.
Manufacturing, MSMEs and Make in India Push
Budget 2026 reinforces India’s manufacturing ambitions.
Key initiatives include Semiconductor Mission 2.0, Bio-Pharma Shakti Mission, electronics component manufacturing support and the creation of rare earth corridors across mineral-rich states. These measures aim to reduce import dependence and improve supply chain resilience.
A one-time concessional duty window for SEZ units to sell in the domestic market addresses capacity utilisation challenges arising from global trade disruptions.
From a market lens, manufacturing-linked stocks, specialty chemicals, electronics EMS players and MSME-focused lenders stand to benefit over the medium to long term.
Technology, AI and Digital Infrastructure
Technology-led growth is a defining pillar of Union Budget 2026.
AI, digital public infrastructure and data-driven services are placed at the centre of India’s growth strategy. The launch of Bharat-VISTAAR, a multilingual AI tool for agriculture, highlights the government’s intent to integrate technology with grassroots development.
The continued push for data centres, cloud infrastructure and AI adoption supports long-term demand for IT services, telecom infrastructure and digital ecosystem players. Industry leaders have welcomed this approach as future-ready and globally competitive.
Agriculture and Rural Development
Agriculture receives targeted support with a focus on productivity and income enhancement.
Key announcements include AI-enabled advisory through Bharat-VISTAAR, the Coconut Promotion Scheme benefiting over three crore people, support for high-value crops like sandalwood, cocoa and cashew, and entrepreneurship in livestock farming.
An allocation of over ₹55,600 crore under the Viksit Bharat Gram Yojana strengthens rural infrastructure and employment opportunities. For markets, these measures support agri-input companies, rural-focused FMCG and agri-tech platforms.
Education, Skills and Workforce Development
Budget 2026 places strong emphasis on aligning education with employability.
Initiatives such as the Education-to-Employment Standing Committee, content creator labs in 15,000 schools and university townships near industrial corridors reflect a shift towards industry-linked learning. Skilling in AI and advanced technologies is prioritised to prepare India’s workforce for future industries.
This structural focus supports long-term productivity growth and benefits education technology, training platforms and employment services.
Healthcare and Social Infrastructure
Healthcare spending sees a strategic boost.
The government announced the setting up of NIMHANS 2.0, upgradation of national mental health institutes and expansion of emergency and trauma care centres at district hospitals. Exemption of basic customs duty on 17 cancer drugs and inclusion of additional rare diseases under duty-free imports provide relief to patients.
Healthcare infrastructure expansion supports hospitals, diagnostics and pharmaceutical sectors over the long term.
Taxation and Capital Market Measures
Direct and Indirect Taxes
Tax proposals aim at simplification and compliance ease. The return revision deadline has been extended to March 31 with a nominal fee. TCS rates under LRS for education and medical purposes have been reduced, and TDS or TCS on select sectors has been rationalised.
Capital Markets
The increase in Securities Transaction Tax on futures and options is aimed at curbing excessive speculation. While this may impact trading volumes in the short term, it is seen as a step towards healthier market participation.
Impact on the Indian Stock Market
In the short term, markets may remain volatile due to global cues and derivatives taxation changes. However, the long-term equity outlook remains constructive.
Infrastructure, capital goods, manufacturing, PSU banks, IT services and logistics are likely beneficiaries. The Budget’s capex-led and technology-focused approach reinforces India’s structural growth story.
Investors with a long-term horizon may view Budget 2026 as supportive rather than disruptive.
Frequently Asked Questions
Is Union Budget 2026 positive for the stock market?
Yes, structurally it supports long-term growth through capex, manufacturing and digital infrastructure, though short-term volatility may persist.
Which sectors benefit most from Budget 2026?
Infrastructure, capital goods, manufacturing, IT services, healthcare and agriculture-linked sectors.
Why was STT increased in derivatives?
To discourage excessive retail speculation and improve market stability.
Does Budget 2026 focus on fiscal discipline?
Yes, the fiscal deficit path continues towards consolidation while maintaining growth spending.
Conclusion
Union Budget 2026 sends a clear message of continuity, confidence and future-readiness. By balancing fiscal prudence with record capital expenditure, embracing AI and digital infrastructure, and focusing on inclusive growth, the government has laid a credible roadmap for India’s long-term economic ambitions.
For investors, understanding these themes is crucial to making informed decisions. Platforms like Swastika Investmart, a SEBI-registered full-service brokerage, support investors with strong research, technology-driven tools, and consistent investor education to navigate evolving market conditions.

Earnings Bonanza Ahead: Key Stocks to Watch as Results Season Heats Up
Summary
- Q3 earnings show sharp divergence across sectors
- Financials, capital goods and new-age companies stand out
- Margin trends and balance sheet quality remain crucial
- Stock-specific action likely to dominate market moves
Results Season Takes Centre Stage in Indian Markets
Indian equity markets are firmly in earnings-driven mode as several companies announced their Q3 numbers post market hours. With valuations elevated across pockets of the market, investors are closely analysing not just revenue growth but profitability, margins and balance sheet strength.
This earnings bonanza ahead is underlining a familiar market reality. Earnings quality matters more than headline growth, and management execution is now under the microscope.
Below is a detailed look at the key companies that reported Q3 results, exactly as declared.
Post Market Hours Earnings: Company-Wise Q3 Highlights
Ather Energy Q3 Highlights (Cons, YoY)
Revenue up 50.19% at Rs 953.6 crore versus Rs 634.9 crore.
EBITDA loss at Rs 72 crore versus loss of Rs 140.7 crore.
Net loss at Rs 83.6 crore versus loss of Rs 197.6 crore.
Tata Chemicals Q3 Highlights (Cons, YoY)
Revenue down 1.12% at Rs 3,550 crore versus Rs 3,590 crore.
EBITDA down 20.5% at Rs 345 crore versus Rs 434 crore.
EBITDA margin down 237 bps at 9.71% versus 12.08%.
Net loss at Rs 93 crore versus loss of Rs 53 crore.
PB Fintech Q3 Highlights (Cons, YoY)
Revenue up 37.1% at Rs 1,771 crore versus Rs 1,292 crore.
EBITDA up ~476% at Rs 159 crore versus Rs 27.6 crore.
EBITDA margin up 690 bps at 9% versus 2.1%.
Net profit up ~164% at Rs 189 crore versus Rs 71.5 crore.
Bajaj Housing Q3 Highlights (Cons, YoY)
Total income up 17.8% at Rs 2,886 crore versus Rs 2,451 crore.
Net profit up 21.3% at Rs 665 crore versus Rs 548 crore.
City Union Bank Q3 Highlights (Standalone, YoY)
NII up 28% at Rs 752 crore versus Rs 588 crore.
Operating profit up 17.7% at Rs 513 crore versus Rs 436 crore.
Provisions up 28% at Rs 96 crore versus Rs 75 crore.
Gross NPA at 2.17% versus 2.42% (QoQ).
Net NPA at 0.78% versus 0.9% (QoQ).
Net profit up 16.1% at Rs 332 crore versus Rs 286 crore.
Utkarsh SFB Q3 Highlights (Standalone, YoY)
NII down 27% at Rs 348 crore versus Rs 480 crore.
Operating loss at Rs 44 crore versus profit of Rs 185 crore.
Provisions up 5.5% at Rs 446 crore versus Rs 423 crore.
Gross NPA at 11.05% versus 12.42% (QoQ).
Net NPA at 4.48% versus 5.02% (QoQ).
Net loss at Rs 375 crore versus loss of Rs 168 crore.
Awfis Space Solutions Q3 Highlights (Cons, YoY)
Revenue up 20.16% at Rs 381.776 crore versus Rs 317.721 crore.
EBITDA up 29.78% at Rs 139.21 crore versus Rs 107.26 crore.
EBITDA margin up 270 bps at 36.46% versus 33.75%.
Net profit up 42.66% at Rs 21.655 crore versus Rs 15.179 crore.
Railtel Q3 Highlights (Cons, YoY)
Revenue up 18.99% at Rs 913.45 crore versus Rs 767.62 crore.
EBITDA up 10.13% at Rs 133.43 crore versus Rs 121.15 crore.
EBITDA margin down 117 bps at 14.6% versus 15.78%.
Net profit down 4.07% at Rs 62.4 crore versus Rs 65.05 crore.
PG Electroplast Q3 Highlights (Cons, YoY)
Revenue up 45.92% at Rs 1,412.13 crore versus Rs 967.69 crore.
EBITDA up 37.23% at Rs 116.88 crore versus Rs 85.17 crore.
EBITDA margin down 52 bps at 8.27% versus 8.8%.
Net profit up 56.68% at Rs 61.9588 crore versus Rs 39.5439 crore.
eMudhra Q3 Highlights (Cons, YoY)
Revenue up 35.4% at Rs 188.01 crore versus Rs 138.85 crore.
EBIT up 32.87% at Rs 31.04 crore versus Rs 23.36 crore.
EBIT margin down 31 bps at 16.5% versus 16.82%.
Net profit up 36.68% at Rs 28.667 crore versus Rs 20.973 crore.
Corona Remedies Q3 Highlights (Cons, YoY)
Revenue up 15.02% at Rs 342.42 crore versus Rs 297.69 crore.
EBITDA up 19.79% at Rs 83.16 crore versus Rs 69.42 crore.
EBITDA margin up 96 bps at 24.28% versus 23.31%.
Net profit down 8.18% at Rs 41.27 crore versus Rs 44.95 crore.
Chalet Hotels Q3 Highlights (Cons, YoY)
Revenue up 27.06% at Rs 581.68 crore versus Rs 457.79 crore.
EBITDA up 29% at Rs 265 crore versus Rs 204 crore.
EBITDA margin at 45.61% versus 44.63%.
Net profit up 28.54% at Rs 124.09 crore versus Rs 96.54 crore.
Honeywell Automation Q3 Highlights (Cons, YoY)
Revenue up 7.14% at Rs 1,168.7 crore versus Rs 1,090.8 crore.
EBITDA up 3.94% at Rs 147.6 crore versus Rs 142 crore.
EBITDA margin down 38 bps at 12.62% versus 13.01%.
Net profit down 8.25% at Rs 121.2 crore versus Rs 132.1 crore.
Olectra Greentech Q3 Highlights (Cons, YoY)
Revenue up 28.76% at Rs 663.6 crore versus Rs 515.37 crore.
EBITDA up 18.1% at Rs 93.22 crore versus Rs 78.93 crore.
EBITDA margin down 126 bps at 14.04% versus 15.31%.
Net profit up 0.15% at Rs 46.4 crore versus Rs 46.33 crore.
Aditya Birla Lifestyle Q3 Highlights (Cons, YoY)
Revenue up 9.57% at Rs 2,343.17 crore versus Rs 2,138.4 crore.
EBITDA up 23.58% at Rs 411.81 crore versus Rs 333.23 crore.
EBITDA margin up 199 bps at 17.57% versus 15.58%.
Net profit up 14.42% at Rs 69.01 crore versus Rs 60.31 crore.
Aarti Industries Q3 Highlights (Cons, YoY)
Revenue up 25.82% at Rs 2,319 crore versus Rs 1,843 crore.
EBITDA up 38.79% at Rs 322 crore versus Rs 232 crore.
EBITDA margin up 129 bps at 13.88% versus 12.58%.
Net profit up 189.13% at Rs 133 crore versus Rs 46 crore.
Paradeep Phosphates Q3 Highlights (Cons, YoY)
Revenue up 15.21% at Rs 5,748.67 crore versus Rs 4,989.55 crore.
EBITDA up 7.84% at Rs 472.49 crore versus Rs 438.1 crore.
EBITDA margin down 56 bps at 8.21% versus 8.78%.
Net profit down 13.03% at Rs 182.06 crore versus Rs 209.34 crore.
Transrail Lighting Q3 Highlights
Revenue up 32.59% at Rs 1,777.19 crore versus Rs 1,340.36 crore.
EBITDA up 28.6% at Rs 208.49 crore versus Rs 162.12 crore.
EBITDA margin down 36 bps at 11.73% versus 12.09%.
Net profit up 17.69% at Rs 109.74 crore versus Rs 93.24 crore.
Thermax Q3 Highlights (Cons, YoY)
Revenue up 4.19% at Rs 2,634.68 crore versus Rs 2,528.72 crore.
EBITDA up 34.83% at Rs 254.82 crore versus Rs 188.99 crore.
EBITDA margin up 219 bps at 9.67% versus 7.47%.
Net profit up 76.16% at Rs 204.18 crore versus Rs 115.9 crore.
Indus Towers Q3 Highlights (Cons, YoY)
Revenue up 7.9% at Rs 8,146 crore versus Rs 7,548 crore.
EBITDA down 35.6% at Rs 4,509 crore versus Rs 6,997 crore.
EBITDA margin down 3,740 bps at 55.3% versus 92.7%.
Net profit down 55.6% at Rs 1,776 crore versus Rs 4,003 crore.
Interarch Building Solutions Q3 Highlights
Revenue up 43.7% at Rs 523 crore versus Rs 364 crore.
EBITDA up 43.2% at Rs 50.3 crore versus Rs 35.1 crore.
EBITDA margin down 10 bps at 9.6% versus 9.7%.
Net profit up 32.2% at Rs 37.3 crore versus Rs 28.2 crore.
Akzo Nobel India Q3 Highlights (Cons, YoY)
Revenue down 13.59% at Rs 907.7 crore versus Rs 1,050.5 crore.
EBITDA down 18.33% at Rs 136.3 crore versus Rs 166.9 crore.
EBITDA margin down 87 bps at 15.02% versus 15.89%.
Net profit down 31.58% at Rs 74.3 crore versus Rs 108.6 crore.
Veedol Corp Q3 Highlights (Cons, YoY)
Revenue up 11.5% at Rs 538 crore versus Rs 482 crore.
EBITDA up 35.3% at Rs 51.6 crore versus Rs 38.1 crore.
EBITDA margin up 170 bps at 9.6% versus 7.9%.
Net profit up 16.6% at Rs 43.6 crore versus Rs 37.3 crore.
Ventive Hospitality Q3 Highlights (Cons, YoY)
Revenue up 28.4% at Rs 685 crore versus Rs 534 crore.
EBITDA up 26.9% at Rs 311 crore versus Rs 245 crore.
EBITDA margin down 50 bps at 45.4% versus 45.9%.
Net profit up ~427% at Rs 117 crore versus Rs 22.2 crore.
Final Takeaway
The earnings bonanza ahead clearly shows that Indian markets are in a phase of sharp stock-level differentiation. Strong revenue growth alone is no longer enough. Margin resilience, balance sheet strength and execution quality are deciding winners and losers.
For investors navigating this earnings-heavy phase, disciplined analysis and timely insights are essential.
Swastika Investmart, a SEBI-registered brokerage, provides in-depth earnings coverage, advanced research tools, tech-enabled platforms and strong customer support to help investors stay ahead during volatile results seasons.
.avif)
Market Set-Up 02 February 2026: Nifty and Bank Nifty Under Pressure
Takeaways
- Global markets ended on a cautious note with US indices closing lower.
- FII and DII were net sellers in cash segment, keeping sentiment fragile.
- Nifty has broken an important swing low, signaling continued weakness.
- Bank Nifty is hovering near 100-DMA support, crucial for near-term trend.
Global Cues Set a Cautious Tone
The trading day begins with mixed to negative global signals. US markets closed in the red with the Dow Jones slipping by 179 points. Dow futures are also trading lower, hinting at risk-off sentiment. Asian markets are reflecting similar caution and GIFT Nifty is indicating a marginal decline of around 5 points.
Such global softness often influences early Indian market momentum, especially when domestic technical structure is already fragile.
What the Data Is Telling Us
Institutional flows remained negative. Foreign Institutional Investors sold around ₹588 crore, while Domestic Institutions offloaded ₹683 crore, taking the combined figure to ₹1,271 crore on the sell side. Persistent outflows explain the lack of follow-up buying in recent sessions.
In derivatives, the picture is mixed. Nifty PCR has slipped to 0.59 from 0.90, showing rising caution. Highest open interest for the 03 Feb series stands at 26000 Call and 24000 Put, while max pain is placed near 25300. India VIX jumped to 15.10, up almost 12.9%, indicating higher volatility expectations.
FII activity in index derivatives shows aggressive addition in call shorts and put longs, suggesting hedging against further downside.
Technical View on Nifty
The benchmark has broken the previous swing low of 24919, confirming that bears remain in control. Momentum indicators are pointing to lack of strength and every bounce is being sold into.
- Immediate support lies between 24575 and 24500.
- Below this, the next demand area emerges around 24330–24200.
- On the upside, the 24900–25000 zone is expected to act as a stiff resistance.
Traders should avoid aggressive bottom fishing until a clear reversal pattern forms. Risk management remains the key.
Technical View on Bank Nifty
Bank Nifty closed below the critical 58500 mark. The 58000 level, which coincides with the 100-DMA, is an important line in the sand.
- A break below 58000 can drag the index towards 57000.
- Resistance is placed around 58700 and 59400 on any recovery.
Private banking heavyweights will decide the next directional move. Participants should track PSU banks separately as they are showing relatively better resilience.
How Should Investors Approach This Market
Volatile phases test patience. Instead of chasing momentum, investors should focus on quality businesses with earnings visibility. Systematic investing and staggered buying work better than emotional trades.
Derivative traders need to respect stop losses as VIX expansion can trigger sharp intraday swings. Hedging portfolios through options strategies can help reduce risk.
Role of Research in Uncertain Times
Market set-ups like these highlight why disciplined research matters. Understanding open interest trends, institutional flows, and technical levels gives an edge over random decision making. Swastika Investmart combines SEBI-registered research, robust technology, and dedicated support to help investors navigate such phases with clarity.
Frequently Asked Questions
1. What is the key level to watch on Nifty now?
The immediate support is 24575–24500. A sustained move below this may open 24330–24200.
2. Why did volatility rise sharply?
India VIX jumped after institutional selling and weak global cues, signaling fear of further downside.
3. What does low PCR indicate?
A PCR near 0.59 shows higher put unwinding and call writing, reflecting cautious sentiment.
4. Is Bank Nifty at a crucial support?
Yes, 58000 around the 100-DMA is a critical level for short-term trend.
Final Thoughts
The current market set-up calls for caution rather than aggression. Global weakness, FII outflows, and technical breakdown suggest traders should prioritize capital protection. Opportunities will emerge, but only for those who stay disciplined and informed.
At Swastika Investmart, investors benefit from strong research tools, investor education, and tech-enabled platforms designed for all market conditions.
.avif)
Big Bounce in Natural Gas Prices: Weather, Supply or Technical Breakout?
TL;DR Summary
- Natural gas prices staged a sharp rebound after weeks of consolidation
- Weather forecasts, supply constraints and short covering fueled the move
- MCX natural gas mirrored global momentum with high volatility
- The bounce highlights the importance of technical levels and data tracking
A Sudden Revival in Natural Gas Prices
The big bounce in natural gas prices surprised many traders who had grown accustomed to range-bound and weak price action. After spending several sessions under pressure, natural gas suddenly surged, triggering fresh discussions across trading desks and dealing rooms.
Was this move driven by changing weather patterns, tightening supply dynamics, or simply a technical breakout after prolonged consolidation? The answer lies in a combination of all three.
For Indian traders tracking MCX natural gas contracts, the bounce offered both opportunity and risk, reinforcing why commodities demand constant attention to global cues.
Weather Plays a Bigger Role Than Many Assume
Shifting Temperature Forecasts Lift Demand Expectations
Natural gas prices are extremely sensitive to weather changes, especially in major consuming regions. Recent forecasts indicated a rise in temperature volatility, with pockets of extreme heat and cold returning earlier than expected.
Increased cooling demand boosts natural gas consumption through power generation. Even a small change in temperature projections can alter demand estimates significantly, leading to quick repricing in futures markets.
Historically, similar weather-driven revisions have sparked sudden rallies, particularly when market positioning is skewed to one side.
Supply-Side Factors Add Fuel to the Bounce
Production Constraints and Storage Concerns
On the supply front, natural gas markets faced fresh concerns around production levels and storage injections. Maintenance activities at key facilities and slower output growth raised questions about near-term availability.
Lower-than-expected storage build data acted as a trigger. When inventories fail to rise as projected, traders quickly reassess surplus assumptions, often leading to short covering.
This pattern has played out multiple times in the past, and the recent bounce followed a familiar script.
The Technical Breakout That Changed Market Sentiment
Key Resistance Levels Were Taken Out
Beyond fundamentals, technical factors played a crucial role in the big bounce in natural gas prices. The commodity had been consolidating below a major resistance zone for weeks.
Once prices decisively crossed this level, algorithmic systems and momentum traders entered fresh long positions. Short sellers were forced to cover, adding momentum to the upside.
In commodity markets, such technical breakouts often act as self-fulfilling moves, especially when volumes expand alongside price.
How Indian Markets Reacted
MCX Natural Gas Sees Sharp Volatility
Indian markets closely followed global cues. MCX natural gas prices witnessed heightened volatility, with intraday swings expanding sharply after the breakout.
For Indian traders, rupee movement and exchange margins added another layer of complexity. While the underlying global trend remained supportive, domestic factors influenced net returns.
This highlights why Indian commodity traders must track both international developments and local market conditions simultaneously.
Regulatory Framework and Risk Management in India
The Securities and Exchange Board of India plays a vital role in maintaining stability during volatile phases. Dynamic margin adjustments and position limits help reduce systemic risk, even though they can increase short-term pressure on leveraged traders.
Such measures ensure long-term market integrity, making disciplined trading and position sizing essential during sharp moves like the recent bounce.
What This Means for Traders and Investors
Short-Term Traders vs Long-Term Participants
For short-term traders, the bounce offered quick opportunities but demanded strict risk management. Chasing momentum without understanding underlying triggers can be costly.
Longer-term participants should focus on broader trends such as supply-demand balance, infrastructure developments, and seasonal consumption patterns rather than single-session moves.
Natural gas remains one of the most volatile commodities, rewarding preparation and punishing complacency.
Why Research and Tools Matter in Commodity Trading
Volatile phases underscore the importance of reliable research and execution platforms. Swastika Investmart, a SEBI-registered brokerage, provides traders with advanced research tools, timely market insights, and a tech-enabled trading experience.
With strong customer support and a focus on investor education, Swastika helps traders navigate complex commodity markets with clarity and confidence rather than speculation.
Frequently Asked Questions
Why did natural gas prices bounce sharply?
The bounce was driven by changing weather forecasts, supply-side concerns, and a technical breakout that triggered short covering.
Is the rally in natural gas sustainable?
Sustainability depends on upcoming weather data, storage levels, and production trends. Volatility is likely to remain high.
How does global natural gas impact MCX prices?
MCX natural gas closely tracks global benchmarks, adjusted for currency movement and domestic market factors.
Is natural gas suitable for beginners?
Due to its volatility, natural gas trading is better suited for experienced traders with strong risk management practices.
How can traders manage risk in natural gas?
Using stop losses, monitoring data releases, and relying on research-backed strategies can help manage sharp price swings.
Final Takeaway
The big bounce in natural gas prices was not driven by a single factor but by a convergence of weather shifts, supply signals, and technical triggers. Such moves remind traders why commodities are dynamic and unforgiving.
Success in these markets depends on preparation, data awareness, and disciplined execution.
If you are looking to trade commodities with expert research, reliable platforms, and dedicated support, it may be time to take the next step.

Brutal Selloff in Gold & Silver: Why Precious Metals Crashed in an Exceptionally Volatile Session?
TL;DR Summary
- Gold and silver prices witnessed a sharp intraday crash amid global risk repricing
- Strong US dollar and rising bond yields triggered heavy profit booking
- Indian MCX prices mirrored global weakness with heightened volatility
- Regulatory norms and margin pressures amplified short-term selling
A Sudden Shock for Precious Metal Investors
The brutal selloff in gold and silver caught many investors off guard. Precious metals, often considered safe-haven assets during uncertainty, witnessed steep declines in a single trading session marked by extreme volatility. Gold prices slipped sharply while silver faced an even deeper fall, triggering stop losses across global and Indian markets.
For Indian investors tracking MCX gold and silver contracts or holding ETFs and sovereign gold bonds, the sudden move raised an important question. Why did precious metals crash when geopolitical and economic risks still remain elevated?
To understand this, one must look beyond headlines and into the confluence of global macro triggers, speculative positioning, and domestic market dynamics.
What Triggered the Brutal Selloff in Gold and Silver?
Strong US Dollar and Rising Bond Yields
One of the primary reasons behind the crash in precious metals was the sharp rise in the US dollar index. Gold and silver are priced in dollars globally, and a stronger dollar makes them more expensive for non-US buyers, reducing demand.
At the same time, US Treasury yields surged as markets reassessed the likelihood of interest rate cuts. Higher yields increase the opportunity cost of holding non-interest-bearing assets like gold, leading institutional investors to rotate capital into bonds.
Historically, such phases have often resulted in short but violent corrections in precious metals, and this session was no different.
Hawkish Central Bank Expectations
Despite earlier optimism around rate cuts, recent macroeconomic data suggested that inflation may remain sticky. This prompted markets to push back expectations of aggressive monetary easing by global central banks.
When central banks maintain a hawkish stance, gold typically faces pressure. Silver, being both a precious and industrial metal, tends to amplify the move, which explains its sharper decline during the session.
Heavy Profit Booking After a Strong Rally
Crowded Long Positions Unwound
Before the crash, gold and silver had rallied strongly over the past few months. This led to a build-up of leveraged long positions across futures markets.
When prices started slipping, algorithmic trading systems and hedge funds triggered stop losses, accelerating the fall. Such cascading exits are common during volatile sessions and often exaggerate price movements beyond fundamentals.
This was a classic example of how sentiment-driven markets can reverse sharply even without a major negative headline.
Impact on Indian Markets and MCX Prices
MCX Gold and Silver Reflect Global Weakness
In India, MCX gold and silver prices tracked global cues closely. MCX silver saw heightened volatility, while gold slipped despite steady physical demand from jewellers.
The fall came at a time when Indian investors were already cautious due to fluctuating rupee movements and margin requirements. A strengthening dollar also put pressure on the rupee, partially cushioning gold’s fall in domestic terms but not enough to prevent losses.
Role of Indian Regulations and Margins
The Securities and Exchange Board of India mandates dynamic margin adjustments during high volatility. As price swings intensified, higher margins forced some retail traders to cut positions, adding to selling pressure.
This regulatory mechanism, while essential for systemic stability, can temporarily deepen corrections during volatile sessions.
Should Indian Investors Be Worried?
Short-Term Volatility vs Long-Term Role of Gold
While the brutal selloff in gold and silver was unsettling, it does not necessarily invalidate the long-term case for precious metals. Gold continues to act as a hedge against currency depreciation, geopolitical risks, and systemic stress.
For long-term investors, such corrections often present opportunities rather than threats, provided allocations are aligned with financial goals and risk tolerance.
Silver, on the other hand, tends to remain more volatile due to its industrial linkage, making disciplined position sizing crucial.
How Swastika Investmart Helps Investors Navigate Volatility
Periods like these highlight the importance of research-backed decision-making. Swastika Investmart, a SEBI-registered brokerage, equips investors with robust research tools, real-time market insights, and expert commentary across commodities and other asset classes.
With strong customer support, tech-enabled trading platforms, and a focus on investor education, Swastika helps traders and investors navigate volatile sessions with clarity rather than panic.
Instead of reacting emotionally to sudden selloffs, informed strategies backed by data and expert guidance make all the difference.
Frequently Asked Questions
Why did gold fall despite global uncertainty?
Gold fell due to a stronger US dollar, rising bond yields, and profit booking after a strong rally, outweighing safe-haven demand in the short term.
Why is silver more volatile than gold?
Silver has a dual role as a precious and industrial metal, making it more sensitive to economic expectations and speculative trading.
Did the rupee movement impact Indian gold prices?
Yes, a weaker rupee partially cushioned the fall in MCX gold prices, though global weakness still dominated.
Is this a good time to invest in gold?
For long-term investors, corrections can offer staggered buying opportunities, provided allocations are aligned with financial goals.
How can traders manage such volatility?
Using proper risk management, understanding margin requirements, and relying on expert research can help manage sharp market swings.
Final Thoughts
The brutal selloff in gold and silver serves as a reminder that even traditional safe havens are not immune to short-term volatility. Markets are constantly repricing expectations, and sudden moves are part of that process.
For Indian investors, staying informed, disciplined, and research-driven is key. If you are looking to trade or invest across commodities with confidence, expert support matters.
%20(3).avif)
FII vs DII Trading Activity: What Recent Flows Signal for Indian Investors Today 30 January 2026
Summary
• Foreign investors were net buyers while domestic institutions booked profits, signaling mixed market sentiment.
• Institutional flows often act as early indicators of short-term market direction.
• Strong domestic participation helps cushion volatility caused by global capital movement.
• Retail investors should focus on fundamentals rather than reacting to daily flow data.
FII vs DII Trading Activity: What Recent Flows Signal for Indian Investors
Institutional money often shapes the trajectory of Indian equity markets. Whether it is Foreign Institutional Investors (FIIs) bringing global capital or Domestic Institutional Investors (DIIs) stabilizing the market with local inflows, tracking their activity helps investors understand underlying sentiment.
On 30 January 2026, market data showed a notable divergence:
- FII/FPI Buy Value: ₹30,492.98 crore
- FII/FPI Sell Value: ₹28,241.61 crore
- Net Flow: +₹2,251.37 crore
Meanwhile:
- DII Buy Value: ₹18,590.13 crore
- DII Sell Value: ₹19,191.16 crore
- Net Flow: -₹601.03 crore
At first glance, this appears to be a classic tug-of-war between global optimism and domestic profit booking. But what does it actually mean for investors and the broader Indian stock market?
Let’s break it down.
Understanding FII and DII Activity
Institutional flows are closely watched because they reflect the conviction of large investors with deep research capabilities.
Who are FIIs and FPIs?
Foreign Institutional Investors and Foreign Portfolio Investors include global asset managers, sovereign funds, pension funds, and hedge funds investing in Indian equities. Their decisions are influenced by:
- Global interest rates
- Currency trends
- Inflation outlook
- Geopolitical stability
- Growth potential in emerging markets
When FIIs turn buyers, it usually signals confidence in India’s economic trajectory.
Who are DIIs?
Domestic Institutional Investors include mutual funds, insurance companies, banks, and pension funds. Unlike foreign investors, DIIs often take a long-term view aligned with India’s structural growth story.
Their presence has become stronger over the past decade due to rising SIP inflows and increased financial awareness among Indian households.
What the Latest Data Suggests
The recent session saw foreign investors step in as net buyers while domestic institutions trimmed positions.
Global Confidence in India
Positive FII inflows often indicate that India remains attractive relative to other emerging markets. Factors that could be driving this include:
- Stable GDP growth expectations
- Government infrastructure spending
- Continued digital and manufacturing expansion
- Regulatory strength under SEBI
Foreign investors typically rotate capital toward economies with predictable policy environments, and India checks many of those boxes.
Why Did DIIs Sell?
DII selling does not automatically signal bearishness. Often, it reflects tactical moves such as:
- Profit booking after market rallies
- Portfolio rebalancing
- Sector rotation
- Managing redemption pressure
For example, if markets approach record highs, fund managers may lock in gains to maintain risk balance.
Impact on Indian Markets
Institutional flows influence liquidity, volatility, and short-term direction.
1. Market Support Levels Strengthen
When FIIs buy aggressively, large-cap stocks usually benefit first because foreign funds prefer liquid counters such as banking, IT, and energy.
This can help indices like the Nifty 50 and Sensex hold key support zones.
2. Reduced Volatility Due to Domestic Cushion
A decade ago, heavy FII selling could trigger sharp corrections. Today, strong DII participation often absorbs that pressure.
This structural shift has made Indian markets more resilient.
3. Sectoral Momentum May Shift
Foreign investors frequently chase growth sectors, while domestic funds lean toward defensives during uncertain phases.
Watching where the money flows can help investors spot emerging trends earlier.
A Real World Example
Consider the post-pandemic rally. FIIs poured capital into Indian equities in anticipation of economic recovery. When global tightening began, many pulled money out.
However, DIIs stepped in aggressively through mutual fund inflows, preventing a deeper correction.
The lesson is clear: markets move not just on earnings but also on liquidity.
Should Retail Investors React to Daily Flow Data?
Short answer: not impulsively.
Institutional numbers are useful indicators, but they should complement, not replace, your investment strategy.
Smart Investor Approach
- Focus on companies with strong balance sheets
- Avoid panic selling during temporary outflows
- Use corrections as accumulation opportunities
- Stay aligned with long-term financial goals
Remember, FIIs trade with global mandates. Your portfolio should reflect personal wealth creation, not short-term noise.
Regulatory Strength Adds Confidence
India’s capital markets operate under the supervision of the Securities and Exchange Board of India (SEBI), ensuring transparency and investor protection.
Key safeguards include:
- Strict disclosure norms
- Robust settlement systems
- Risk management frameworks
- Continuous market surveillance
These factors enhance trust among both domestic and foreign investors, supporting sustained capital inflows.
How the Right Broker Makes a Difference
Navigating institutional trends requires reliable research, fast execution, and investor education.
Swastika Investmart, a SEBI registered stockbroker, empowers investors with:
- Advanced research tools for data-driven decisions
- Tech-enabled trading platforms
- Dedicated customer support
- Strong focus on investor awareness
- Insights that simplify complex market movements
Whether you are a beginner or an experienced trader, having the right ecosystem helps you act with confidence rather than speculation.
Frequently Asked Questions
Is FII buying always bullish for the market?
Not always. While it signals optimism, markets also depend on earnings, macroeconomic factors, and domestic participation.
Why are DIIs important for market stability?
They provide consistent liquidity through mutual fund inflows, which helps absorb sudden foreign outflows.
Should I track FII and DII data daily?
Weekly or trend-based tracking is more meaningful than reacting to single-day movements.
Which sectors benefit most from FII inflows?
Typically banking, IT, infrastructure, and large-cap growth stocks attract foreign capital first.
Can institutional flows predict market direction?
They offer clues but should be combined with technical and fundamental analysis for better decision-making.
Conclusion
The latest FII and DII trading activity reflects a healthy balance between global confidence and domestic prudence. Foreign inflows highlight India’s growing stature in the world economy, while domestic institutions continue to provide stability.
For investors, the takeaway is simple: observe institutional trends, but stay committed to disciplined investing.
With a trusted partner like Swastika Investmart, you gain access to credible research, modern technology, and expert support that can help transform market insights into smarter financial decisions.
Start your investing journey with confidence and stay prepared for every market phase.
👉 Open your trading and investment account with Swastika Investmart
Stay informed. Stay disciplined. Stay invested.

NSE DRHP IPO Filing: A Complete Guide for Indian Investors
Summary
- NSE DRHP IPO filing is the first formal step toward the long-awaited NSE listing
- DRHP reveals business details, risks, and IPO structure but not final pricing
- SEBI scrutiny plays a critical role in protecting investor interest
- NSE IPO could reshape India’s capital market landscape
- Investors should track filings closely and rely on research-driven platforms
NSE DRHP IPO Filing: A Complete Guide for Indian Investors
The NSE DRHP IPO filing has been one of the most anticipated developments in Indian capital markets. For retail and institutional investors alike, the potential listing of the National Stock Exchange carries both symbolic and financial significance. But what exactly does an NSE DRHP filing mean, and why does it matter so much?
This blog breaks down the concept in clear, simple language, connects it with real market context, and explains how investors can prepare themselves better.
What Is a DRHP and Why It Matters
A Draft Red Herring Prospectus (DRHP) is a preliminary document submitted to the market regulator before a company launches its IPO. It acts as a detailed disclosure report for potential investors.
In the case of the NSE DRHP IPO filing, the document is expected to outline:
- NSE’s business model and revenue streams
- Financial performance over recent years
- Regulatory history and risk factors
- Details of promoters and key shareholders
- The structure of the proposed IPO
Importantly, a DRHP does not disclose the final issue price or listing date. Its primary purpose is transparency.
For investors, this document serves as the first real opportunity to evaluate whether the IPO aligns with their risk appetite and investment goals.
Why the NSE IPO Is Unique
Unlike most IPOs, the NSE listing is not about a growing startup or a capital-hungry company. NSE is already a dominant institution in India’s financial ecosystem.
Here is what makes the NSE DRHP IPO filing special:
A Market Infrastructure Institution Going Public
NSE is not just another company. It is the backbone of India’s equity derivatives and cash markets. Its listing could set a benchmark for governance and disclosure standards.
Likely Offer for Sale Structure
Market expectations suggest the IPO may largely be an offer for sale. This means existing shareholders may dilute their stake rather than NSE raising fresh capital.
Regulatory Sensitivity
Because NSE is a systemically important institution, regulatory scrutiny is far more intense compared to regular IPOs. This makes the DRHP stage even more critical.
SEBI’s Role in the NSE DRHP Process
The NSE DRHP IPO filing cannot move forward without strict regulatory clearance. SEBI’s review focuses on:
- Past governance and compliance issues
- Transparency in revenue and ownership disclosures
- Fair access to information for all investors
- Risk disclosures related to market operations
SEBI’s involvement ensures that investor interest remains protected, especially given NSE’s influence over Indian capital markets.
For retail investors, this regulatory oversight adds a layer of comfort and trust.
Potential Impact on Indian Stock Markets
The NSE IPO could have broader implications beyond just one listing.
Improved Transparency
Once listed, NSE will need to meet continuous disclosure norms. This could further strengthen trust in market infrastructure.
Valuation Benchmarks
The listing may help establish valuation benchmarks for financial market infrastructure companies in India.
Increased Retail Participation
A high-profile IPO like NSE often attracts first-time investors, increasing market participation and awareness.
Sentiment Booster
The NSE DRHP IPO filing itself can act as a sentiment trigger, especially during phases when primary markets are active.
What Investors Should Look for in the NSE DRHP
When the DRHP becomes public, investors should focus on a few key areas:
Revenue Mix
Understanding how much NSE earns from trading, data services, technology, and other streams helps assess sustainability.
Risk Disclosures
Operational risks, regulatory changes, and technology dependence should be read carefully.
Shareholding Structure
Knowing who is selling and how much gives insight into long-term confidence levels.
Corporate Governance
Board composition and governance practices matter greatly for an institution like NSE.
This is where research-driven platforms and professional guidance become invaluable.
How Swastika Investmart Adds Value for IPO Investors
Navigating complex IPOs like NSE requires more than headlines. This is where Swastika Investmart stands out.
With SEBI registration, strong in-house research, and technology-enabled investing tools, Swastika Investmart helps investors:
- Understand IPO documents in simple language
- Access well-researched insights without hype
- Make informed decisions aligned with their goals
- Get reliable customer support during volatile market phases
- Learn continuously through investor education initiatives
Rather than pushing aggressive narratives, the focus remains on clarity, compliance, and long-term wealth creation.
Frequently Asked Questions
What does NSE DRHP IPO filing mean for investors
It means NSE has initiated the formal IPO process, giving investors early visibility into its business and risks.
Does DRHP confirm the IPO date
No. DRHP is only a draft document. The final IPO timeline is announced later.
Will NSE raise fresh capital through the IPO
Market expectations suggest the issue may largely be an offer for sale, though final details will be clear in the DRHP.
Is NSE IPO suitable for retail investors
Suitability depends on individual risk appetite, investment horizon, and understanding of market infrastructure businesses.
Where can investors get reliable IPO insights
SEBI-registered platforms with strong research frameworks offer the most dependable guidance.
Conclusion: Preparing for the NSE IPO the Smart Way
The NSE DRHP IPO filing is more than just another market event. It represents a significant milestone in India’s financial market evolution. For investors, it is an opportunity to participate in a core institution that powers everyday trading activity.
However, informed participation is key. Reading disclosures carefully, understanding risks, and relying on credible research can make a meaningful difference.
If you are planning to track upcoming IPOs and want research-backed insights with a strong compliance framework, consider exploring Swastika Investmart’s tech-enabled investing platform.
Smart investing starts with informed decisions.

Bank of Baroda Q3 FY26 Results Highlight Stable Growth Amid Banking Headwinds
Summary
- Bank of Baroda reported steady year on year profit growth in Q3 FY26
- Net Interest Income remained stable despite margin pressures
- Asset quality and balance sheet strength continue to support earnings visibility
- PSU banking stocks remain sensitive to interest rate and policy signals
Bank of Baroda Q3 FY26 Performance at a Glance
Bank of Baroda’s Q3 FY26 results reflect the growing maturity of India’s public sector banking turnaround. At a time when credit costs, interest rate movements, and deposit competition remain key challenges, the bank delivered consistent profitability with controlled risk metrics.
The numbers indicate a phase of consolidation rather than aggressive expansion, which is often seen as a positive sign for long term investors in PSU banks.
Key Financial Highlights from Q3 FY26
During the December 2025 quarter, Bank of Baroda posted stable operational performance compared to the same period last year.
Net Profit Shows Steady Improvement
The bank reported a net profit of ₹5,054 crore in Q3 FY26, up from ₹4,837 crore in Q3 FY25. This represents a year on year growth of around 4.5 percent. The improvement reflects disciplined lending practices, stable credit quality, and better control over operating expenses.
Net Interest Income Remains Flat
Net Interest Income stood at ₹11,800 crore, marginally higher than ₹11,786 crore reported last year. While growth was muted, maintaining NII levels in a competitive deposit environment highlights balance sheet resilience.
Focus on Sustainable Earnings
Unlike earlier cycles where PSU banks relied heavily on one time gains, Bank of Baroda’s earnings in Q3 FY26 appear more core driven. This strengthens confidence in the sustainability of profits going forward.
What Worked in Bank of Baroda’s Favour
Stable Credit Demand
Retail loans, MSME credit, and selective corporate lending continued to support loan growth. Government infrastructure spending and steady economic activity provided a supportive backdrop.
Improved Asset Quality
Although exact NPA figures are not highlighted in the snapshot, the consistent profit growth suggests that slippages remain under control. Over the past few years, Bank of Baroda has significantly cleaned up its loan book, which now acts as a strong foundation.
PSU Banking Reforms Paying Off
Regulatory oversight by RBI, improved governance standards, and recapitalisation initiatives have strengthened public sector banks. Bank of Baroda remains one of the key beneficiaries of this structural shift.
Challenges to Watch Going Ahead
Margin Pressure Environment
With deposit rates remaining elevated and competition for low cost funds increasing, net interest margins across the banking sector may face pressure in coming quarters.
Interest Rate Sensitivity
Any shift in RBI’s monetary stance can impact treasury income, loan pricing, and credit growth momentum. PSU banks tend to be more sensitive to policy signals than private peers.
Market Reaction and Investor Sentiment
For equity markets, Bank of Baroda’s Q3 FY26 results are largely in line with expectations. The absence of negative surprises often supports stock stability, especially in a volatile broader market.
PSU bank stocks are typically valued on return ratios, asset quality trends, and earnings consistency rather than high growth alone. From that perspective, Bank of Baroda’s steady performance keeps it relevant for long term portfolio allocation.
Broader Impact on Indian Banking Sector
The Q3 FY26 performance highlights how Indian banks are transitioning from recovery to steady growth mode. Strong regulatory supervision, improved credit discipline, and digital adoption have reshaped the sector.
Institutions like Bank of Baroda operate under strict SEBI disclosure norms and RBI banking regulations, ensuring transparency for investors. These frameworks also help reduce systemic risk, which is crucial for long term market stability.
How Investors Can Interpret These Results
For conservative investors, stable PSU banks offer predictable earnings and dividend potential. For active traders, quarterly results like these help gauge near term sentiment and sector rotation trends.
Understanding such results requires deeper insight beyond headline numbers, including margin trajectory, credit mix, and policy signals.
This is where platforms like Swastika Investmart play a meaningful role by offering SEBI registered research, detailed result breakdowns, advanced trading tools, and continuous investor education.
👉 Open your trading and investment account here
Frequently Asked Questions
How did Bank of Baroda perform in Q3 FY26?
Bank of Baroda reported steady profit growth with stable Net Interest Income, reflecting balanced lending and controlled risk.
Is Bank of Baroda’s profit growth sustainable?
The profit growth appears sustainable as it is supported by core banking income and improved asset quality rather than one time gains.
What are the key risks for Bank of Baroda going forward?
Margin pressure, deposit competition, and interest rate changes remain key risks to monitor.
How do Bank of Baroda’s results impact PSU banking stocks?
Stable results generally support sentiment for PSU banks, especially among long term investors focused on earnings visibility.
Final Takeaway
Bank of Baroda’s Q3 FY26 results reinforce the narrative of steady progress rather than aggressive expansion. While growth may appear moderate, the quality of earnings and balance sheet strength remain reassuring.
For investors navigating India’s evolving banking landscape, combining such result analysis with structured research and expert guidance can make decision making more confident and disciplined. Swastika Investmart continues to support investors with the tools, insights, and education needed to stay ahead in dynamic market conditions.

Jindal Steel Q3 FY26 Results: Revenue Growth Meets Profit Pressure
Summary
- Jindal Steel reported a sharp YoY drop in net profit despite higher revenues
- EBITDA and margins declined due to cost pressures and pricing challenges
- Domestic demand stayed resilient, but global steel headwinds impacted profitability
- Near-term stock performance may remain volatile, with focus on margin recovery
Understanding Jindal Steel’s Q3 FY26 Performance
Jindal Steel’s Q3 FY26 results reflect a familiar theme playing out across the Indian metals sector: volume resilience and revenue growth on one side, and margin compression on the other. While the company managed to expand its topline, profitability took a significant hit due to weaker realizations, elevated input costs, and global steel market softness.
For investors tracking the steel sector closely, these numbers highlight why earnings quality matters just as much as revenue growth.
Key Financial Highlights from Q3 FY26
During the quarter ended December 2025, Jindal Steel reported mixed financial performance when compared with the same period last year.
Profitability Takes a Hit
Net profit for Q3 FY26 declined sharply to ₹188.5 crore from ₹951 crore in Q3 FY25, marking an 80 percent year-on-year fall. This steep decline underlines the pressure faced by steel producers amid softer global prices and higher operating costs.
Revenue Shows Healthy Growth
Revenue for the quarter rose to ₹13,026 crore compared with ₹11,750 crore in the previous year, translating into a growth of nearly 11 percent. Strong domestic demand, infrastructure spending, and steady dispatch volumes supported the topline.
EBITDA and Margins Under Pressure
EBITDA fell to ₹1,632 crore from ₹2,184 crore, down over 25 percent year on year. Operating margins compressed sharply to 12.5 percent from 18.6 percent, a decline of 610 basis points. This margin contraction was driven by higher raw material costs, energy expenses, and pricing pressure in export markets.
What Impacted Jindal Steel’s Q3 Earnings
Global Steel Market Weakness
International steel prices remained subdued during the quarter due to excess supply and muted demand from key economies. Export realizations were under pressure, affecting blended margins.
Rising Input Costs
Costs related to coal, power, logistics, and maintenance remained elevated. Even with operational efficiencies, these expenses weighed on EBITDA performance.
Domestic Demand Stability
On the positive side, domestic steel demand in India remained stable, supported by government-led infrastructure projects, housing activity, and industrial capex. This helped Jindal Steel maintain volumes and revenue growth.
How the Market May React
From a stock market perspective, such results often lead to short-term volatility. While revenue growth signals demand resilience, sharp profit erosion tends to concern investors focused on return ratios and earnings sustainability.
Institutional investors typically track margin trends closely in cyclical sectors like steel. Any signs of cost normalization, better realizations, or improvement in global steel prices could become near-term triggers for sentiment recovery.
Broader Impact on the Indian Steel Sector
Jindal Steel’s Q3 FY26 performance mirrors broader trends seen across Indian metal stocks. The sector continues to balance strong domestic demand against global uncertainty.
From a regulatory standpoint, Indian steel producers operate under environmental norms, mining regulations, and export-import policies governed by authorities such as the Ministry of Steel and SEBI disclosure requirements. These frameworks ensure transparency while also influencing cost structures and long-term capacity planning.
What Should Investors Watch Going Forward
Margin Recovery Signals
Any improvement in operating margins, whether through cost control or pricing recovery, will be closely monitored in upcoming quarters.
Global Steel Price Movement
Changes in international steel demand, especially from China and developed markets, can significantly impact realizations.
Capex and Balance Sheet Strength
Investors should track debt levels, capex discipline, and cash flow generation to assess long-term financial stability.
How Swastika Investmart Helps Investors Navigate Such Results
Interpreting quarterly earnings, especially in cyclical sectors like steel, requires more than headline numbers. Swastika Investmart supports investors with SEBI-registered research, detailed earnings analysis, sector insights, and tech-enabled trading platforms.
Whether you are a long-term investor or an active trader, having access to timely research tools and expert insights can make a meaningful difference during volatile earnings seasons.
👉 Open your trading and investment account today
Frequently Asked Questions
Why did Jindal Steel’s profit fall sharply in Q3 FY26?
The profit decline was mainly due to lower EBITDA margins caused by higher costs and weaker steel price realizations.
Did Jindal Steel’s revenue grow in Q3 FY26?
Yes, revenue grew by nearly 11 percent year on year, supported by stable domestic demand and steady volumes.
How important are margins for steel stocks?
Margins are critical because steel is a cyclical business. Even small changes in costs or prices can significantly impact profitability.
Is the Indian steel sector still fundamentally strong?
Domestic demand remains healthy due to infrastructure and industrial growth, but global factors continue to influence earnings volatility.
Final Thoughts
Jindal Steel’s Q3 FY26 results underline the reality of operating in a cyclical industry where revenue growth does not always translate into higher profits. While short-term challenges persist, long-term prospects will depend on cost efficiency, demand recovery, and disciplined capital allocation.
For investors looking to stay ahead of earnings trends and sector movements, partnering with a research-driven platform like Swastika Investmart can provide clarity, confidence, and consistency in decision-making.

Why Kevin Warsh as Fed Chair Is Spooking Global Markets
Summary
- Speculation around Kevin Warsh as Fed Chair has triggered profit booking across metals, crypto and equities
- A potentially hawkish Federal Reserve strengthens the US dollar and tightens global liquidity
- Gold and commodities corrected sharply as interest rate expectations shifted
- Indian markets felt the ripple effect, with Sensex and Nifty snapping a three-day rally
Kevin Warsh Fed Chair Buzz and Why Markets Care
Global financial markets rarely react to political speculation unless it directly impacts liquidity, interest rates or currency stability. The growing buzz around Kevin Warsh being the frontrunner for the next Chair of the US Federal Reserve ticks all three boxes.
Formerly a Federal Reserve Governor, Warsh is viewed as supportive of lower interest rates over the long term. However, compared to more aggressive stimulus advocates, he is also considered relatively cautious. That balance has made markets nervous.
As rumours gained traction, investors across asset classes began reassessing risk, leading to visible corrections in precious metals, cryptocurrencies and equities worldwide.
Why Precious Metals Reacted First
Gold prices fell over four percent as markets priced in the possibility of a less accommodative Federal Reserve. The relationship is straightforward.
A hawkish Fed typically leads to higher interest rates and a stronger US dollar. Since gold does not generate yield, rising rates reduce its appeal relative to interest-bearing assets. At the same time, a stronger dollar makes gold more expensive for non-US buyers.
Analysts pointed out that gold was already in overbought territory, making it vulnerable to sharp profit booking once macro uncertainty surfaced. The Warsh speculation acted as the trigger.
This move also weighed on broader commodity markets, as tighter global liquidity generally dampens demand expectations.
Impact on Bitcoin and the Crypto Market
Cryptocurrencies thrive in environments with abundant liquidity and low borrowing costs. As expectations of monetary easing were scaled back, digital assets came under pressure.
Bitcoin, often treated as a high-risk, high-reward asset, tends to struggle when interest rates rise and risk appetite declines. Investors shift capital towards safer instruments, reducing speculative exposure.
Concerns around heavy capital spending by Big Tech on artificial intelligence without immediate earnings visibility added to the cautious tone. With credit spreads already tight, markets that were firmly risk-on began to pause.
This combination of tighter liquidity expectations and valuation concerns proved unfriendly for crypto assets.
Equities Feel the Heat Globally
Equity markets are sensitive to funding costs. A hawkish Federal Reserve raises the cost of capital, potentially slowing economic growth and corporate earnings.
US markets ended mostly lower, with futures indicating further pressure. Technology-heavy indices were particularly affected due to their dependence on future growth and lower discount rates.
European markets showed relative resilience, but Asian equities displayed mixed performance. While South Korea’s Kospi closed higher, key indices in Japan, China and Hong Kong ended in the red.
This divergence highlights how global markets are reassessing regional exposure amid shifting US monetary expectations.
What It Meant for Indian Markets
Indian equities were not immune to global cues. Both Sensex and Nifty snapped a three-day rally, dragged lower by metal and IT stocks.
Metal stocks mirrored the decline in global commodity prices, while IT stocks faced pressure due to their sensitivity to US interest rates and currency movements. A stronger dollar often impacts IT margins and client spending outlook.
Despite the decline, the broader structure of Indian markets remains supported by domestic flows, a stable regulatory environment and improving corporate balance sheets.
SEBI’s robust market oversight and India’s improving macro fundamentals continue to provide long-term stability, even during phases of global uncertainty.
How Investors Can Navigate Such Macro Shocks
Episodes like these underline the importance of diversification and disciplined investing. Short-term volatility driven by global policy speculation often creates noise rather than long-term trend shifts.
Investors should focus on asset allocation, quality businesses and risk management rather than reacting emotionally to headlines. Monitoring global central bank signals is important, but decisions should align with individual financial goals.
This is where research-backed platforms and professional guidance make a difference.
Why Swastika Investmart Stands Out in Volatile Markets
Swastika Investmart, a SEBI-registered brokerage, equips investors with strong research tools, timely market insights and tech-enabled investing platforms.
From daily market updates to in-depth macro analysis, the focus remains on investor education and informed decision-making. Reliable customer support and transparent processes further help investors stay confident during uncertain times.
In fast-changing global environments, having access to credible research and structured advice can significantly improve outcomes.
Frequently Asked Questions
Why did gold prices fall on Kevin Warsh Fed Chair speculation
Markets fear a more hawkish Fed, which supports higher interest rates and a stronger dollar, both negative for gold prices.
How does a hawkish Federal Reserve affect Indian markets
It can lead to foreign fund outflows, pressure on equities and currency volatility, especially in rate-sensitive sectors.
Is Bitcoin directly impacted by US interest rate expectations
Yes, tighter liquidity and higher rates reduce risk appetite, which often weighs on cryptocurrencies.
Should long-term investors worry about such global news
Short-term volatility is common, but long-term investors should stay focused on fundamentals and asset allocation.
How can Indian investors track global macro risks better
Using research-driven platforms, market insights and professional advisory services helps investors stay prepared.
Final Thoughts
Speculation around leadership changes at the US Federal Reserve highlights how interconnected global markets have become. While such developments can trigger short-term volatility, they also offer learning opportunities for disciplined investors.
With the right research, tools and guidance, navigating global uncertainty becomes far more manageable.
If you want to invest with confidence backed by SEBI-registered expertise, advanced research tools and strong investor support, explore smart investing with Swastika Investmart.
FII DII Data Today 29 January 2026: Domestic Investors Offset Foreign Selling
Summary
- Today’s FII DII data for 29 January 2026 shows continued foreign selling
- Domestic institutional investors stepped in with strong buying support
- Net institutional flows remained positive despite market volatility
- Data reflects cautious global sentiment but resilient domestic confidence
Understanding Today’s FII and DII Activity in Indian Markets
Institutional activity plays a critical role in shaping short-term market direction. The FII DII data for today, 29 January 2026, provides valuable insight into how global and domestic investors are positioning themselves ahead of key economic and policy events.
As per provisional data released by the exchanges, foreign institutional investors were net sellers, while domestic institutional investors absorbed the selling pressure with strong inflows. This divergence highlights a familiar trend in Indian markets where domestic capital continues to act as a stabilising force during periods of global uncertainty.
FII DII Data Snapshot for Today 29 Jan 2026
On 29 January 2026, the institutional flow picture looked like this:
- Foreign Institutional Investors (FII): Net sellers worth approximately ₹394 crore
- Domestic Institutional Investors (DII): Net buyers worth around ₹2,639 crore
- Overall Net Institutional Flow: Positive at nearly ₹2,245 crore
This data reflects a scenario where foreign investors remained cautious, while domestic institutions displayed confidence in Indian equities.
Why Were FIIs Selling Today?
Foreign investors have been selectively reducing exposure to emerging markets, including India, due to a combination of global factors.
Key reasons behind FII selling on 29 January 2026 include:
- Uncertainty around global interest rate trajectories
- Volatility in US bond yields and currency markets
- Risk-off sentiment ahead of major global economic data
- Pre-positioning before India’s Union Budget
Such FII outflows are not uncommon during periods of global macro uncertainty and do not necessarily indicate weakness in India’s long-term fundamentals.
Strong DII Buying Signals Domestic Confidence
What clearly stood out in today’s FII DII data is the aggressive buying by domestic institutional investors. Mutual funds, insurance companies, and pension funds stepped in to support the market.
Domestic investors are increasingly guided by:
- Strong retail participation through SIPs
- Long-term economic growth visibility
- Stable corporate earnings outlook
- Policy continuity and regulatory transparency
The buying interest from DIIs helped cushion the impact of foreign selling and prevented sharper market declines.
Impact on Indian Equity Markets Today
Despite mixed institutional flows, Indian markets showed resilience during the session. While benchmark indices experienced volatility, heavy DII participation ensured that broader sentiment remained stable.
Banking and select large-cap stocks benefited from domestic buying, while IT and export-oriented sectors reflected global caution. This internal rotation within the market is typical when domestic investors selectively deploy capital rather than chase broad-based rallies.
What Today’s FII DII Trend Means for Retail Investors
For retail investors, the FII DII data for 29 January 2026 offers an important lesson. Markets do not move solely on foreign flows anymore. India’s growing domestic investor base now plays a decisive role in market stability.
When DIIs absorb FII selling, it often indicates confidence in medium to long-term fundamentals. However, it does not eliminate short-term volatility, especially around events like the Union Budget or global policy announcements.
Regulatory Perspective and Market Structure
India’s strong institutional participation is supported by a robust regulatory framework overseen by SEBI. Measures around transparency, disclosure norms, and investor protection have strengthened market confidence over time.
This framework has enabled domestic institutions to scale participation, ensuring that Indian markets are less dependent on volatile foreign capital flows compared to the past.
How Swastika Investmart Helps Investors Track Institutional Trends
Tracking daily FII and DII activity requires reliable data interpretation, not just raw numbers. Swastika Investmart, a SEBI-registered brokerage, supports investors with research-driven insights, institutional flow analysis, and market intelligence tools.
With technology-enabled platforms, timely research reports, and dedicated customer support, Swastika Investmart helps investors understand how institutional behaviour aligns with broader market trends.
Frequently Asked Questions
What is FII DII data?
FII DII data shows daily buying and selling activity of foreign and domestic institutional investors in Indian equity markets.
Why is today’s FII DII data important?
The data for 29 January 2026 highlights strong domestic buying that offset foreign selling, offering insights into market resilience.
Does FII selling mean markets will fall?
Not always. Strong DII participation can stabilise markets even when FIIs sell.
Who are domestic institutional investors?
DIIs include mutual funds, insurance companies, pension funds, and other large domestic financial institutions.
How can investors use FII DII data effectively?
It should be used as a sentiment indicator alongside fundamentals, earnings trends, and macroeconomic factors.
Final Thoughts
The FII DII data for today, 29 January 2026, clearly shows that domestic investors continue to play a crucial role in supporting Indian markets. While global uncertainty keeps foreign investors cautious, India’s long-term growth narrative remains intact.
For investors seeking clarity in such mixed environments, informed decision-making backed by quality research becomes essential.
👉 Open your trading and investment account with Swastika Investmart
Stay informed. Stay disciplined. Stay invested.
Market Closing Summary 30 January 2026: Indices End Lower Ahead of Union Budget
Summary
- Indian equity benchmarks ended mildly lower amid cautious pre-Budget trade
- Nifty IT underperformed due to global tech weakness and US rate concerns
- Banking stocks saw profit booking after recent gains
- Broader markets remained range-bound with selective buying
- Investors stayed defensive ahead of Union Budget announcements
How the Indian Stock Market Closed Today
Indian equity markets ended the final trading session of the week on a cautious note as investors preferred to reduce risk ahead of the Union Budget. Benchmark indices slipped modestly, reflecting profit booking in heavyweight sectors like banking and IT, while defensive pockets provided limited support.
At the closing bell, the Nifty 50 settled near 25,320, while the Sensex closed around 82,270. The broader tone remained subdued, with traders unwilling to take aggressive positions before key fiscal policy cues expected over the weekend.
The overall market sentiment was influenced by a mix of global uncertainty, Budget-related anticipation, and valuation concerns after the recent rally.
Index Performance at a Glance
- Nifty 50 declined around 0.4 percent, dragged by IT and banking stocks
- Sensex slipped nearly 300 points, mirroring weakness in frontline names
- Bank Nifty underperformed, falling close to 0.6 percent
- Nifty IT saw sharper cuts of over 1 percent amid global tech pressure
The intraday charts showed volatility during the second half of the session, indicating nervousness among short-term traders.
Why Markets Closed Lower Today
Pre-Budget Caution Dominated Sentiment
With the Union Budget just days away, market participants chose caution over conviction. Historically, Indian markets tend to trade in a narrow range before the Budget as investors wait for clarity on taxation, fiscal deficit targets, and sector-specific incentives.
Many institutional investors preferred trimming positions, especially in stocks that have delivered strong gains in recent weeks.
IT Stocks Faced Global Headwinds
The IT sector emerged as the biggest drag on the benchmarks. Concerns over slower discretionary spending in the US and uncertainty around interest rate cuts weighed on IT majors.
A stronger dollar and mixed cues from Nasdaq overnight further pressured sentiment. This led to broad-based selling across large-cap IT stocks, pulling the Nifty IT index lower.
Banking Stocks Saw Profit Booking
Banking stocks witnessed mild profit booking after a strong run-up earlier this month. While asset quality trends remain stable and credit growth healthy, traders booked gains ahead of the Budget, especially in PSU banks and private lenders.
The Bank Nifty’s decline reflected short-term caution rather than any structural weakness.
Sectoral Performance Overview
IT and Banking Lagged
Information technology and banking emerged as the worst-performing sectors of the day. Heavyweights in these spaces faced selling pressure, impacting overall index movement.
FMCG and Pharma Offered Stability
Defensive sectors like FMCG and pharmaceuticals provided some support to the market. These sectors often attract buying interest during uncertain periods due to predictable earnings and lower volatility.
Mid and Small Caps Remained Range-Bound
The broader market showed resilience despite frontline weakness. Mid-cap and small-cap indices traded sideways, with selective stock-specific action driven by earnings announcements and sector news.
Market Breadth and Investor Activity
Market breadth was slightly negative, with declines marginally outnumbering advances. Volumes were moderate, indicating that most participants stayed on the sidelines.
Domestic institutional investors remained selective buyers, while foreign portfolio investors appeared cautious amid global macro uncertainty and upcoming domestic policy triggers.
Regulatory and Policy Context
From a regulatory standpoint, market participants are closely tracking cues related to capital gains taxation, fiscal discipline, and sector allocations in the upcoming Budget. Any indication from the government on infrastructure spending, banking reforms, or incentives for manufacturing could significantly influence market direction next week.
SEBI’s continued focus on market transparency and investor protection has helped maintain stability, even during phases of uncertainty.
What Today’s Market Close Means for Investors
The market closing summary for 30 January 2026 highlights a classic pre-Budget setup. Volatility remains contained, but direction is missing. For long-term investors, such phases often present opportunities to accumulate quality stocks gradually rather than chase short-term momentum.
Traders, on the other hand, may continue to face choppy conditions until clear Budget cues emerge.
How Swastika Investmart Helps You Navigate Such Markets
In uncertain market environments like this, having access to reliable research and timely insights becomes crucial. Swastika Investmart, a SEBI-registered investment firm, supports investors with in-depth market analysis, real-time research calls, and technology-driven trading platforms.
Whether it is understanding sector rotation, tracking Budget-sensitive stocks, or managing risk through informed strategies, Swastika Investmart empowers investors with data-backed decision-making and strong customer support.
Frequently Asked Questions
Why did the Indian market fall on 30 January 2026?
Markets declined mainly due to pre-Budget caution, profit booking in banking stocks, and weakness in IT shares driven by global cues.
Which sector performed the worst today?
The IT sector underperformed the most, followed by banking stocks.
Is this market correction a concern for long-term investors?
No. The current decline appears to be a short-term consolidation rather than a structural downturn.
How does the Union Budget impact stock markets?
The Budget influences markets through tax policies, government spending, fiscal deficit targets, and sector-specific incentives.
What strategy should investors follow before the Budget?
A cautious, staggered investment approach focusing on fundamentally strong stocks is generally preferred.
Final Takeaway
The Indian stock market ended lower on 30 January 2026, reflecting caution rather than panic. With the Union Budget around the corner, volatility is likely to persist in the short term, but long-term fundamentals remain intact.
For investors looking to stay ahead of market moves and policy-driven opportunities, expert guidance and disciplined research are essential.
👉 Open your trading and investment account with Swastika Investmart today
Stay informed. Stay invested. Stay prepared.

Q3 Earnings Day: Volatility Expected as Major F&O Stocks Report Numbers
Q3 Earnings Day: Volatility Expected as Major F&O Stocks Report Numbers
Earnings season is one of the most volatile phases for Indian equity markets, and this Q3 earnings day is shaping up to be a crucial one. Several heavyweight stocks from sectors like FMCG, metals, auto, fintech, power finance, and IT services are reporting their December quarter numbers, setting the stage for sharp price moves in the derivatives segment.
When large F&O stocks announce results, markets do not just react to profit numbers. Guidance, one-time costs, regulatory impacts, and management commentary often play a bigger role in deciding short-term trends. With mixed earnings and rising cost pressures emerging across sectors, traders and investors should brace for heightened volatility.
Key Takeaways at a Glance
- Major F&O stocks are reporting mixed Q3 earnings
- One-time labour code provisions are impacting profits across sectors
- Fintech and metals stand out with strong turnarounds
- FMCG and auto show margin and demand pressure
- Volatility in index and stock-specific derivatives is likely to remain high
Why Q3 Earnings Matter More Than Usual This Time
The December quarter reflects both festive demand and cost trends before the year-end. In Q3 FY26, companies are also dealing with regulatory adjustments related to the new labour codes, commodity price swings, and uneven consumption recovery.
For the market, this means earnings surprises can quickly translate into sharp movements in stock prices, especially in F&O counters where positions are heavily leveraged.
This earnings day is a classic example of how numbers alone do not tell the full story.
Stock-Wise Q3 Highlights and Market Implications
Swiggy: Losses Widen Despite Scale-Up
The food delivery platform reported a consolidated net loss of ₹1,065 crore in Q3 FY26, widening 33 percent from last year. While revenue growth remains steady, higher operational and expansion costs continue to weigh on profitability.
Market focus remains on how quickly the company can move towards breakeven. For traders, such results often lead to volatility as expectations shift rapidly.
Tata Motors Commercial Vehicles: Profit Impacted by One-Time Costs
Tata Motors’ commercial vehicle business reported a 48 percent year-on-year decline in net profit at ₹705 crore. Interestingly, profit before tax rose sharply by 65 percent to ₹2,568 crore.
The gap was largely due to one-time labour code-related costs. This highlights why headline profit numbers should be read carefully. Markets typically adjust valuations once such exceptional items are stripped out.
ITC: Stable Core, Temporary Earnings Pressure
ITC posted a consolidated net profit of ₹4,931 crore, slightly below market expectations. The shortfall was primarily due to a one-time labour code provision and a base effect from an exceptional item last year.
The company’s core FMCG and cigarette businesses remain stable, which long-term investors often focus on more than quarterly noise.
Paytm: A Turning Point Quarter
One97 Communications delivered a standout performance, reporting a net profit of ₹225 crore compared to a loss in the same quarter last year. Revenue grew 20 percent to ₹2,194 crore.
This marks a psychological shift for the stock, as profitability brings renewed confidence. Fintech stocks often react strongly to such turning points, making them closely watched in the F&O space.
Vedanta: Riding the Commodity Wave
Vedanta reported a robust 61 percent jump in consolidated profit to ₹5,710 crore, supported by a near 37 percent rise in revenue.
Strong metal prices and operational efficiency boosted performance. Commodity-linked stocks often see momentum-driven moves after such earnings, especially when global trends remain supportive.
Colgate Palmolive India: Margins Under Regulatory Pressure
Colgate’s net profit remained flat at ₹323.9 crore, even as revenue grew marginally. Regulatory changes impacted costs, limiting profit growth.
FMCG stocks tend to see muted reactions in such cases, but commentary on pricing power and demand remains critical for future direction.
REC: Stable Earnings with Expense Pressure
REC reported a marginal 0.58 percent dip in net profit at ₹4,052 crore due to higher expenses. The power financier continues to benefit from strong loan demand, but cost control remains an area to watch.
PSU financial stocks usually see measured reactions unless there is a surprise on asset quality or guidance.
KPIT: Labour Code Costs Hit IT Margins
KPIT’s net profit dropped 29 percent to ₹133 crore, primarily due to a ₹60 crore provision related to the new labour code.
IT stocks are currently sensitive to margin commentary, as global demand visibility remains uneven.
Gillette India: Strong Consumption Signals
Gillette posted a healthy 36.9 percent rise in profit to ₹172 crore, supported by double-digit revenue growth.
Such results reinforce selective strength in urban consumption, even as broader FMCG demand remains mixed.
Voltas: Demand Softness Weighs on Profits
Voltas reported a 35.4 percent decline in net profit, with revenue also slipping slightly. The air-conditioning segment faced margin pressure and uneven demand.
Consumer durable stocks often see sharp reactions when profitability diverges from expectations.
What This Means for Indian Markets
This earnings day reinforces a broader theme playing out in Indian markets. Corporate India is navigating a transition phase where regulatory changes and cost pressures are reshaping profit profiles.
For traders, this environment favours disciplined risk management rather than aggressive directional bets. For investors, it highlights the importance of looking beyond one quarter and focusing on balance sheet strength and business sustainability.
SEBI’s emphasis on transparency and timely disclosures ensures that such earnings data is quickly priced in, increasing short-term volatility but improving long-term market efficiency.
How Investors Can Navigate Earnings Volatility
Periods like this reward preparation. Tracking expectations, understanding one-time costs, and avoiding emotional reactions can make a meaningful difference.
Platforms like Swastika Investmart support investors with strong research tools, detailed earnings insights, and reliable customer support. Being SEBI registered, the focus remains on informed decision-making rather than speculation.
Frequently Asked Questions
Why do F&O stocks show higher volatility during earnings?
Because derivatives involve leverage, even small surprises in earnings can lead to large price movements.
Should investors trade on earnings day?
Only if they understand the risks. Many long-term investors prefer to wait for volatility to settle.
Are one-time costs a red flag?
Not always. One-time items like labour code provisions do not reflect core business performance.
Which sectors are showing strength this quarter?
Metals and select fintech stocks have delivered stronger earnings momentum.
How can retail investors manage earnings risk?
By focusing on fundamentals, diversifying portfolios, and avoiding leveraged positions without proper understanding.
Final Thoughts
Q3 earnings day is a reminder that markets move on expectations as much as numbers. With mixed results across major F&O stocks, volatility is a natural outcome.
Staying informed, patient, and disciplined is the best strategy in such phases. If you want access to structured research, real-time insights, and investor-friendly platforms, Swastika Investmart can help you navigate earnings season with confidence.
.avif)
Hero Moto, MOIL, Angel One, Blue Star – Stocks in News 02 Feb 2026
Summary
- Hero MotoCorp reported 26% YoY jump in January sales, reflecting demand recovery.
- MOIL approved a JV with Madhya Pradesh State Mining Corporation for manganese mining.
- Angel One declined after Budget proposal to increase STT on derivatives.
- Blue Star detected unauthorized access to installation data and tightened security.
What Is Driving Today’s Market Mood
Indian equities are reacting to a mix of corporate updates and Budget-linked changes. Stock-specific triggers are likely to dominate as investors weigh growth visibility, regulatory costs, and governance practices. Here is a clear breakdown of the four major names in focus.
Hero MotoCorp – Sales Momentum Points to Rural Revival
Hero MotoCorp delivered a standout performance in January with 5.57 lakh units sold, compared to 4.42 lakh units last year, marking a 26 percent year-on-year growth. The numbers underline improving rural cash flows, better financing penetration, and healthy replacement demand.
The company has been expanding its premium portfolio and EV presence while protecting leadership in the commuter segment. Consistent volume recovery strengthens confidence about FY26 earnings trajectory.
Impact on Indian Markets
Auto is a key barometer of consumption. Strong dispatches from the segment often lift sentiment for component makers, NBFCs, and tyre companies. If margin stability accompanies volumes, the stock could see positive re-rating.
MOIL – Joint Venture to Boost Long-Term Capacity
MOIL’s board approved creation of a joint venture with Madhya Pradesh State Mining Corporation for manganese ore mining in the state. The partnership is aimed at securing raw material availability and improving logistical efficiency.
Manganese remains critical for steel manufacturing and emerging battery technologies. Domestic capacity expansion aligns with India’s focus on mineral self-reliance and infrastructure growth.
Impact on Indian Markets
This development improves revenue visibility for MOIL and supports the broader metals theme. Investors tracking PSU mining plays may view this as a structural positive.
Angel One – STT Hike Weighs on Brokerage Stocks
Angel One witnessed selling pressure after the Union Budget proposed an increase in Securities Transaction Tax on derivatives—options STT raised to 0.05% from 0.02% and futures STT to 0.15% from 0.10%.
Higher transaction costs can impact trading volumes and margins for discount brokers where derivatives form a large revenue share.
Impact on Indian Markets
The change may moderate retail participation in F&O in the near term. The market will watch whether brokers pass on costs or absorb part of the hit.
Blue Star – Data Security Incident Reported
Blue Star informed exchanges about unauthorized access to its product installation data. The company has taken immediate steps to restrict access and strengthen cybersecurity protocols.
While operations remain unaffected, such events highlight the rising importance of digital governance and data protection in listed entities.
Impact on Indian Markets
Stocks typically react to uncertainty around compliance and potential liabilities. Transparent communication from management will be key to restore confidence.
What Should Investors Do Now
- Focus on companies showing real earnings momentum rather than event-driven spikes.
- Monitor how the STT change reshapes volumes in the brokerage space.
- Auto and metals themes continue to reflect India’s domestic growth story.
- Give weight to governance and cybersecurity disclosures while selecting stocks.
A disciplined approach backed by credible research becomes essential in such news-driven markets.
Frequently Asked Questions
1. Why did Hero MotoCorp sales rise sharply?
Improved rural income, better financing options, and strong product acceptance helped volumes grow 26% YoY.
2. How will MOIL’s JV benefit the company?
It strengthens manganese ore supply, supports capacity expansion, and aligns with India’s mineral security goals.
3. Why is Angel One stock falling?
The Budget increased STT on derivatives, which could affect trading activity and brokerage revenues.
4. Is Blue Star’s data incident serious?
The company has acted quickly to contain the issue; operational impact appears limited at this stage.
Closing Note
News-based opportunities can create short-term volatility but also open doors for informed investing. Tracking fundamentals, policy changes, and corporate governance is vital before taking decisions.
At Swastika Investmart, investors get access to SEBI-registered research, tech-enabled platforms, and dedicated support to navigate such market events with confidence.
Market Setup for 30 January 2026: Global Cues, FII Data and Nifty Outlook : What Indian Investors Should Track Today
Summary
- Global cues remain mixed with pressure from US futures and cautious Asian markets
- GIFT Nifty signals a weak to flat start for Indian equities
- FII activity in derivatives is mixed while DIIs remain strong buyers
- Technical levels suggest downside support near 25,150 on Nifty and 59,600 on Bank Nifty
- Volatility remains low but budget-related positioning is clearly visible
Market Setup for 30 January 2026
Indian equity markets head into Friday’s session with a cautious undertone as global signals turn mixed and traders stay selective ahead of key macro and policy triggers. With Union Budget expectations building and derivative data showing divergent positioning, today’s market setup requires a disciplined, data-backed approach rather than aggressive trades.
This market setup for 30 January 2026 highlights global market cues, FII and DII activity, derivatives positioning, volatility trends and technical levels for Nifty and Bank Nifty to help investors make informed decisions.
Global Market Cues Set a Cautious Tone
Overnight, US markets ended on a mixed note. While the Dow Jones managed marginal gains, futures are indicating weakness, with Dow futures trading lower by over 250 points. This suggests risk appetite remains fragile as investors globally reassess interest rate expectations and corporate earnings momentum.
Asian markets are trading mixed, reflecting the absence of a clear global direction. Weakness in US futures combined with selective buying in Asia often translates into a muted opening for Indian markets.
Adding to this cautious setup, GIFT Nifty is trading nearly 165 points lower, hinting at a gap-down opening for benchmark indices.
FII and DII Activity Shows Divergence
Cash Market Trends
Foreign Institutional Investors continued their selling streak in the cash segment, offloading shares worth approximately ₹394 crore. However, Domestic Institutional Investors stepped in strongly, buying equities worth nearly ₹2,639 crore.
This divergence highlights an important trend in Indian markets. While foreign investors remain cautious due to global uncertainties, domestic institutions continue to show confidence in India’s long-term growth story. This internal strength often cushions sharp market declines.
Derivatives Positioning Reveals Mixed Bias
FII activity in index derivatives reflects a lack of clear conviction.
- Futures shorts have increased sharply compared to longs
- Call writing remains aggressive, indicating resistance at higher levels
- Significant put writing suggests strong support zones below
Such positioning typically points towards range-bound movement with intraday volatility rather than a trending market.
For traders, this reinforces the importance of respecting support and resistance levels rather than chasing breakouts prematurely.
Volatility Remains Comfortable but Watchful
India VIX is hovering near 13.3, down marginally. While this indicates that panic is absent, low volatility ahead of major events like the Union Budget often precedes sudden spikes.
Historically, periods of low VIX during budget weeks tend to reward option sellers initially, but traders must stay alert as directional moves can emerge quickly once clarity develops.
Nifty Technical Outlook for Today
From a technical standpoint, the Nifty spot index is expected to open lower, aligning with global cues.
Key Support Levels
- 25,150 is the first immediate support
- Below this, 25,000 and 24,900 become crucial downside zones
These levels are important not just technically but also psychologically, as round numbers often attract defensive buying.
Key Resistance Levels
- 25,450 remains the first hurdle
- A stronger resistance is placed near 25,600
Unless Nifty sustains above these resistance levels with strong volumes, upside may remain capped.
Bank Nifty Outlook Signals Caution
Bank Nifty continues to mirror broader market uncertainty, with PSU and private banks showing selective weakness.
Support Levels
- 59,600 is the immediate support
- Below this, 59,000 and 58,500 come into focus
Resistance Levels
- 60,000 remains a psychological barrier
- 60,600 acts as a higher resistance zone
Banking stocks often dictate intraday momentum. A breakdown below key supports may increase pressure on benchmark indices.
How This Market Setup Impacts Indian Investors
For short-term traders, this market setup suggests focusing on intraday levels, option strategies and disciplined stop-loss management. Choppy conditions often reward patience rather than aggressive bets.
For long-term investors, continued DII buying and stable volatility reflect confidence in India’s structural growth. Temporary corrections can offer opportunities to accumulate quality stocks, especially in sectors aligned with budget priorities such as infrastructure, manufacturing and financial services.
SEBI-regulated brokers and research-backed platforms become particularly important in such environments, where data interpretation matters more than market noise.
Why Research-Driven Investors Prefer Swastika Investmart
In uncertain market setups like this, investors benefit from working with a SEBI-registered broker that combines research depth with technology-driven execution.
Swastika Investmart offers
- SEBI-registered credibility and transparent practices
- Strong derivative and cash market research tools
- Dedicated customer support for active traders and long-term investors
- Investor education initiatives to help clients understand market cycles
Such strengths allow investors to navigate volatile sessions with confidence and clarity.
Frequently Asked Questions
Is the market expected to open gap-down today?
Yes, GIFT Nifty and weak US futures suggest a gap-down or subdued opening.
Are FIIs bearish on Indian markets?
FIIs are cautious in the cash market, but derivative data shows mixed positioning rather than outright bearishness.
What is the best approach for traders today?
Range-based strategies with strict risk management are preferable in the current setup.
Does low India VIX mean low risk?
Not necessarily. Low VIX ahead of major events can quickly turn volatile, so caution is advised.
Should long-term investors worry about today’s setup?
No. Domestic institutional buying indicates continued confidence in India’s long-term growth.
Final Thoughts
The market setup for 30 January 2026 reflects a cautious but controlled environment. Mixed global cues, divergent institutional activity and clearly defined technical levels suggest that discipline and research will be key to navigating today’s session successfully.
If you are looking to trade or invest with confidence backed by strong research and SEBI-registered credibility, explore smarter investing with Swastika Investmart.
👉 Open your trading account today
Smart decisions begin with informed research.

Economic Survey 2025–26 Signals Moderation: What 6.8–7.2% GDP Growth Means for India
Key Takeaways
- FY26 GDP growth estimated at 7.4%, FY27 projected at 6.8–7.2%
- Inflation remains under control, boosting macro stability
- Manufacturing, exports, and infrastructure show structural strength
- Financial inclusion and investor participation hit record highs
- Policy focus shifts from speed to sustainability and resilience
Understanding the Big Picture of Economic Survey 2025–26
India’s Economic Survey 2025–26 paints a picture of a fast-growing economy that is consciously choosing stability over overheating. While headline GDP growth is expected to moderate slightly in FY27 to the 6.8–7.2% range, the underlying fundamentals remain strong, diversified, and resilient.
Rather than chasing unsustainable growth, the survey highlights India’s transition into a balanced expansion phase, supported by manufacturing revival, controlled inflation, financial inclusion, and long-term capital formation.
GDP and Growth Outlook: Moderation, Not Weakness
The first advance estimates peg real GDP growth for FY26 at 7.4%, while FY27 growth is projected between 6.8% and 7.2%. This moderation reflects global uncertainties, tighter financial conditions, and cautious consumption trends, not domestic stress.
India’s potential growth rate remains close to 7%, which keeps it among the fastest-growing major economies globally. Compared to peers facing stagnation or recessionary pressures, India’s growth trajectory continues to stand out.
Inflation and Macro Stability Provide Strong Support
One of the most reassuring signals from the survey is low and stable inflation. Domestic inflation averaged 1.7% between April and December 2025, giving policymakers room to focus on growth rather than firefighting price pressures.
Low inflation improves:
- Household purchasing power
- Corporate margin visibility
- Interest rate stability
For investors, this environment supports long-term capital allocation into equities and infrastructure-linked themes.
Manufacturing Revival and the PLI Effect
Manufacturing Gross Value Added grew 7.72% in Q1 and 9.13% in Q2 of FY26, confirming a structural recovery rather than a temporary rebound.
The Production Linked Incentive framework has attracted over ₹2 lakh crore in actual investments, leading to:
- Incremental production exceeding ₹18.7 lakh crore
- Creation of more than 12.6 lakh jobs
- Strengthening of electronics, auto, pharma, and semiconductor supply chains
India’s Semiconductor Mission has also advanced, with 10 projects worth ₹1.6 lakh crore, signaling progress toward strategic self-reliance.
Exports, Services, and Global Integration
Despite global trade challenges, India’s share of global merchandise exports nearly doubled from 1% in 2005 to 1.8% in 2024.
Services exports reached a record $387.6 billion in FY25, growing 13.6%, while remittances touched $135.4 billion, keeping India the world’s largest recipient.
These numbers reflect India’s growing role as a global services hub and a stable destination for cross-border capital.
Financial Sector Strength and Rising Investor Base
Banking sector health continues to improve, with Gross NPAs falling to a multi-decade low of 2.2% by September 2025.
Retail participation in markets has surged:
- Over 12 crore unique investors
- Nearly 25% women participation
This broad-based financialisation supports long-term equity market depth and stability.
Infrastructure, Energy, and Logistics Transformation
Infrastructure expansion remains a key growth pillar:
- High-speed corridors expanded nearly ten-fold since FY14
- Over 3,500 km of railway lines added in FY26
- India ranks 3rd globally in renewable energy capacity
Power sector reforms have led to a historic turnaround, with DISCOMs reporting a positive PAT of ₹2,701 crore in FY25 for the first time.
Social Progress and Inclusive Growth
The survey highlights strong progress in social indicators:
- Over 55 crore Jan Dhan accounts
- More than 31 crore workers registered on the e-Shram portal
- Multidimensional poverty reduced sharply to 11.28%
- Expansion of IITs, IIMs, AIIMS, and international campuses
These improvements strengthen consumption resilience and human capital formation over the long term.
What This Means for Indian Markets
For investors, the survey suggests:
- No policy shocks or fiscal stress
- Continued support for capex-led sectors
- Stable backdrop for equities and long-term investing
Rather than short-term growth spikes, the focus is clearly on durable wealth creation.
FAQs
Is India’s growth slowing sharply?
No. Growth is moderating from a high base but remains among the strongest globally.
Which sectors benefit most from the survey outlook?
Manufacturing, infrastructure, renewables, banking, and services exports.
Does low inflation support equity markets?
Yes. It improves earnings visibility and supports valuation stability.
How does this impact retail investors?
Stable growth and rising financial participation create a favorable long-term environment.
Conclusion: Stability Is the New Strength
The Economic Survey 2025–26 confirms that India is moving into a phase of measured, resilient growth. Strong fundamentals, disciplined policy, and rising investor participation form a solid foundation for long-term wealth creation.
For investors seeking research-backed insights, sectoral clarity, and tech-enabled investing, Swastika Investmart, a SEBI-registered firm, offers strong research tools, investor education, and reliable customer support to navigate evolving markets confidently.

Union Budget 2026–27: Everything You Need to Know Before Budget Day
Union Budget 2026–27: Everything You Need to Know Before Budget Day
As Budget Day approaches, conversations around taxes, government spending, and economic priorities begin to dominate headlines. The Union Budget 2026–27 is no different. It arrives at a time when India’s economy remains resilient despite global uncertainty, making this Budget especially important for citizens, businesses, and investors alike.
Whether you are a salaried individual, a small business owner, or a stock market participant, understanding the Union Budget helps you make better financial decisions. Before the Finance Minister rises in Parliament on February 1, here is a clear and simple guide to everything you need to know.
Key Points to Know at a Glance
- Union Budget 2026–27 will be presented on February 1
- It outlines the government’s income, spending, and fiscal strategy
- Budget announcements influence taxes, savings, and investments
- Markets react to policy direction more than short-term headlines
- Long-term investors focus on implementation, not just announcements

What Is the Union Budget and Why It Matters
The Union Budget is the government’s annual financial blueprint. Prepared by the Ministry of Finance and presented under Article 112 of the Constitution, it details how much the government plans to earn and how it intends to spend that money during the financial year from April 1 to March 31.
In simple terms, the Budget shows the government’s priorities. Higher allocations to infrastructure, healthcare, or education signal focus areas for growth. Tax proposals affect household finances, while spending plans guide economic momentum.
For investors, the Union Budget is not just about immediate market reactions. It provides cues on fiscal discipline, reform intent, and sectoral opportunities that shape long-term returns.
When and How the Union Budget 2026–27 Will Be Presented
The Union Budget 2026–27 will be presented on February 1. In recent years, this date has allowed faster implementation of Budget measures from the beginning of the financial year.
The Budget process begins with the President’s address to a joint sitting of the Lok Sabha and Rajya Sabha. This speech outlines the government’s vision and policy agenda for the year. Following this, the Finance Minister presents the Budget in the Lok Sabha.
Once tabled, the Budget is debated in Parliament, examined by standing committees, and finally passed. This process ensures legislative scrutiny and accountability.
Revenue Budget and Capital Budget Explained Simply
The Union Budget is broadly divided into two main components.
The Revenue Budget deals with routine income and expenses. Revenue receipts include taxes such as income tax and GST, along with non-tax income like dividends and interest. Revenue expenditure covers salaries, pensions, subsidies, and welfare schemes. A shortfall here leads to a revenue deficit.
The Capital Budget focuses on long-term economic development. Capital receipts include borrowings and loan recoveries, while capital expenditure is spent on infrastructure projects such as highways, railways, ports, hospitals, and schools. This section plays a critical role in driving economic growth.
What Investors Should Watch Before Budget Day
Investors closely track the Union Budget because it often sets the tone for market trends. While sharp reactions on Budget Day are common, seasoned participants look beyond short-term volatility.
Key areas to watch include capital expenditure allocation, fiscal deficit targets, tax policy stability, and reforms linked to manufacturing, energy, and infrastructure. Announcements related to public sector undertakings, divestment, and financial sector reforms also influence market sentiment.
Historically, markets tend to reward consistency and credible execution rather than headline-grabbing announcements.
Impact of Union Budget 2026–27 on Indian Markets
The Indian stock market usually responds in two phases. The first is an immediate reaction based on expectations versus announcements. The second phase unfolds over months as policies are implemented.
A Budget that balances growth with fiscal discipline generally boosts investor confidence. Clear policy signals encourage domestic participation and attract foreign investment. Coordination between fiscal policy and monetary policy, guided by institutions like the Reserve Bank of India and SEBI, further strengthens market stability.
For retail investors, staying disciplined and aligned with long-term goals matters more than reacting to Budget Day swings.
Why the Union Budget Matters to Citizens
For households, the Union Budget has a direct impact on daily life. Changes in income tax slabs, deductions, and exemptions affect take-home income. Allocations for healthcare, education, and social welfare influence access to essential services.
For example, a salaried individual looks for clarity on tax savings, while a small business owner tracks compliance rules and credit availability. The Budget connects national policy with personal financial planning.
Interim Budget vs Full Budget Explained
In election years, the government presents an Interim Budget instead of a full Budget. An Interim Budget allows necessary spending but avoids major policy changes. Once elections conclude, the new government presents a full Union Budget.
This practice ensures continuity while respecting democratic norms.
Navigating Budget Volatility with the Right Support
Budget season can be overwhelming. Headlines move quickly, opinions differ, and market reactions can be noisy. This is where reliable research and guidance become essential.
Swastika Investmart, a SEBI registered brokerage, helps investors navigate such periods with strong research tools, timely insights, and investor education. Its tech-enabled platforms and dedicated customer support empower investors to make informed decisions rather than emotional ones.
Frequently Asked Questions
When will the Union Budget 2026–27 be presented?
The Union Budget 2026–27 will be presented on February 1.
Does the Union Budget affect stock markets?
Yes. Budget announcements influence investor sentiment, sector outlooks, and market direction.
What is the difference between Revenue and Capital Budget?
Revenue Budget covers regular income and expenses, while Capital Budget focuses on long-term investments.
Should investors change portfolios on Budget Day?
Most experts recommend focusing on long-term fundamentals rather than reacting to short-term volatility.
Why is the Union Budget important for taxpayers?
It determines tax rules, deductions, and government spending that directly affect household finances.
Final Thoughts
The Union Budget 2026–27 is more than a financial document. It is a roadmap that outlines India’s economic priorities and shapes decisions for investors, businesses, and citizens. Understanding its structure and intent helps you prepare calmly and confidently for the year ahead.
If you want to stay ahead of Budget-driven market trends with credible research and expert support, Swastika Investmart can be a valuable partner in your investment journey.

Voltas Q3 FY26 Results: Profitability Takes a Hit Despite Stable Revenue
Summary
- Voltas reported a 35.7% YoY drop in net profit in Q3 FY26
- Revenue remained largely flat, declining marginally by 1.1% YoY
- EBITDA and operating margins faced pressure due to costs and competition
- Cooling demand stayed steady, but profitability remains the key concern
- Long-term investors should track margin recovery and execution closely
Voltas Q3 FY26 Results: Profitability Takes a Hit Despite Stable Revenue
Voltas Limited, a Tata Group company and a household name in air conditioning and cooling solutions, announced its Q3 FY26 financial results, delivering a mixed performance. While revenues held steady in a challenging consumption environment, profitability weakened sharply, raising fresh questions about margin sustainability and cost pressures.
For investors tracking the consumer durables space, the Voltas Q3 FY26 results offer valuable insight into how input costs, competitive intensity, and demand trends are shaping earnings outcomes.
Key Financial Highlights of Voltas Q3 FY26 Results
Net Profit Declines Sharply
Voltas reported a net profit of ₹84.9 crore in Q3 FY26, compared with ₹132 crore in Q3 FY25, marking a 35.7% year-on-year decline.
This fall in profit reflects higher operating expenses, margin pressure in the cooling products segment, and continued investments in distribution and branding.
In real terms, this means that even with similar sales volumes, Voltas earned significantly less on every rupee of revenue during the quarter.
Revenue Remains Largely Flat
Revenue for the quarter stood at ₹3,070 crore, marginally lower than ₹3,105 crore reported in the same quarter last year.
While this 1.1% YoY dip may seem modest, it highlights the broader trend across Indian consumer durables, where demand growth has been uneven due to inflation, weather variability, and cautious discretionary spending.
For Voltas, stable revenue indicates that brand strength and dealer reach remain intact, even as pricing power faces resistance.
EBITDA and Margins Under Pressure
EBITDA for Q3 FY26 came in at ₹176.6 crore, down from ₹197 crore in Q3 FY25, translating to a 10.7% decline.
Operating margin compressed to 5.7% from 6.4%, a contraction of 70 basis points.
Margin compression was driven by:
- Higher raw material and logistics costs
- Competitive pricing in room air conditioners
- Increased promotional spending during the festive season
This trend mirrors the broader Indian manufacturing sector, where companies are prioritizing volumes over margins amid stiff competition.
Segment-Level Perspective and Market Context
Cooling Products: Volumes Stable, Margins Weak
The room air conditioner market in India continues to grow structurally, supported by rising urbanisation, electrification, and climate patterns. However, near-term pricing pressure from aggressive competitors has limited margin expansion.
Despite reasonable sales traction, Voltas had to absorb cost increases rather than pass them fully to consumers, impacting profitability.
Project Business and Execution Risks
The project business segment remains sensitive to execution timelines, cost overruns, and working capital cycles. Delays or cost escalations in infrastructure-linked projects can weigh on quarterly earnings, something investors need to monitor closely.
What Voltas Q3 FY26 Results Mean for Investors
From an investor’s perspective, the Voltas Q3 FY26 results signal a near-term earnings challenge, not a breakdown in business fundamentals.
Key takeaways include:
- Revenue stability reflects brand strength and distribution reach
- Profit decline highlights cost sensitivity and pricing pressure
- Margin recovery will be crucial for earnings re-rating
- Long-term demand drivers for cooling products remain intact
For retail investors, this quarter underscores why tracking margins, not just topline growth, is essential when evaluating consumer-focused companies.
Broader Impact on Indian Markets
The muted profitability reported by Voltas aligns with trends seen across Indian consumer durables and FMCG players in recent quarters. Rising costs, promotional intensity, and selective consumer spending have collectively impacted earnings growth.
From a regulatory standpoint, listed companies like Voltas continue to comply with SEBI disclosure norms, offering transparency and timely updates to market participants.
Such earnings outcomes often influence sectoral sentiment and can lead to short-term stock price volatility, especially around result seasons.
How Swastika Investmart Helps Investors Navigate Earnings Seasons
Understanding quarterly results requires more than headline numbers. At Swastika Investmart, SEBI-registered research teams focus on:
- Deep earnings analysis beyond surface-level metrics
- Sectoral comparisons and margin trend tracking
- Risk-aware investment strategies for volatile markets
- Tech-enabled platforms for real-time insights and execution
With strong customer support and investor education initiatives, Swastika Investmart helps investors make informed decisions rather than reactive ones during result-driven market swings.
Frequently Asked Questions
What were Voltas Q3 FY26 net profit numbers?
Voltas reported a net profit of ₹84.9 crore in Q3 FY26, down 35.7% year-on-year.
Why did Voltas margins decline in Q3 FY26?
Margins declined due to higher input costs, competitive pricing pressure, and increased promotional spending.
Did Voltas revenue grow in Q3 FY26?
Revenue remained largely flat at ₹3,070 crore, slightly lower than the previous year.
Is Voltas still a long-term growth story?
Long-term demand for cooling products remains strong, but margin recovery will be key for earnings growth.
How should investors react to Voltas Q3 FY26 results?
Investors should monitor future quarters for margin improvement and cost control rather than focusing on a single quarter.
Conclusion: Stay Informed, Stay Disciplined
The Voltas Q3 FY26 results reflect a challenging operating environment where maintaining profitability is harder than sustaining sales. While near-term pressures persist, the company’s brand strength and market presence remain valuable assets.
For investors navigating such earnings cycles, disciplined analysis and trusted research matter more than short-term noise.
Open your trading and investment account with Swastika Investmart to access expert research, smart tools, and market-ready insights tailored for Indian investors.
👉 Open your trading and investment account with Swastika Investmart

Why did silver suddenly cross ₹4 lakh?
Key Takeaways
- Silver crossed ₹4 lakh in India due to rising global fear and geopolitical tensions
- US–Iran conflict risks triggered strong safe-haven buying
- The US Fed’s tight stance and a weak dollar added momentum
- Silver is outperforming due to investor demand, supply tightness and momentum
Silver’s Sudden Spike Took Markets by Surprise
Silver prices shocked Indian markets on Thursday as they surged past the ₹4 lakh mark for the first time. The move was swift, sharp, and driven more by fear than fundamentals of jewellery demand.
On the MCX, silver prices jumped nearly 4 percent to hit an all-time high of around ₹4,00,780 per kilogram. Globally, silver climbed close to $120 per ounce, marking one of its strongest rallies in recent years.
This sudden rise left many investors asking one simple question. Why did silver move so fast, and why now?
Fear Drives Money Towards Safety
Whenever uncertainty rises, money changes behaviour. Investors stop chasing growth and start protecting capital. Historically, precious metals have played this role during periods of fear.
This rally in silver is not about festive demand or industrial expansion alone. It is about global anxiety.
Wars, geopolitical risks, and economic uncertainty push investors towards assets that hold value during turmoil. Silver, along with gold, sits at the centre of that safe-haven universe.
Rising US–Iran Tensions Lit the Spark
The immediate trigger for the surge came from escalating tensions between the US and Iran.
Reports of increased US military presence in the Middle East unsettled global markets. On top of that, former US President Donald Trump issued a strong warning to Iran, stating that refusal to engage in nuclear talks could invite far more severe military action in the future.
Markets react quickly to war risks. The possibility of conflict in a geopolitically sensitive region instantly pushed investors towards precious metals.
Silver responded with force.
The US Federal Reserve Kept Uncertainty Alive
Another major factor supporting silver prices was the stance of the US Federal Reserve.
The Fed kept interest rates unchanged, but its messaging remained cautious. Inflation continues to stay elevated, and policymakers made it clear that rate cuts will not come quickly.
High interest rates slow economic growth and keep uncertainty alive. This environment reduces confidence in risk assets and increases demand for stores of value like silver and gold.
For precious metals, uncertainty is often more powerful than rate cuts themselves.
Weak US Dollar Added Fuel to the Rally
A softer US dollar played a crucial supporting role in silver’s rise.
When the dollar weakens, precious metals become cheaper for buyers using other currencies. This improves global demand and pushes prices higher across international markets.
As the dollar slipped, silver prices gained strength both globally and in India, amplifying the rally on domestic exchanges like the MCX.
What Happened to Silver Prices Exactly?
The numbers tell the story clearly.
In India:
- MCX silver jumped around 4 percent in a single session
- Prices hit a fresh all-time high of ₹4,00,780 per kilogram
Globally:
- Silver climbed close to $120 per ounce
- Spot silver touched record levels above $119
- Silver is up more than 60 percent so far this year
This kind of move rarely happens without strong underlying fear and momentum.
Why Silver Is Moving Faster Than Gold
Silver has a unique dual personality. It is both a precious metal and an industrial metal.
Unlike gold, silver is widely used in electronics, renewable energy, electric vehicles, and advanced manufacturing. At the same time, it remains a cheaper alternative to gold for investors seeking safety.
Several factors are working together here:
- Strong investor demand as fear rises
- Tight global supply conditions
- Momentum buying as prices break records
When prices start rising quickly, traders and investors jump in, further accelerating the move.
Gold Also Joined the Rally
Gold did not stay behind.
Spot gold surged past $5,590 per ounce, extending its remarkable run. Gold is already up about 27 percent this year, after rising nearly 64 percent last year.
Gold benefits most during periods of war risk, inflation concerns, and currency weakness. The same forces lifting silver are also pushing gold to new records.
What About Other Precious Metals?
Platinum gained around 1 percent and had already touched record levels earlier this week. Palladium, however, slipped slightly as its demand outlook remains comparatively weaker.
Among all precious metals, silver clearly emerged as the strongest performer.
What This Means for Indian Markets
This rally has important implications for Indian investors.
First, it highlights how closely Indian commodity prices track global events. Second, it reinforces the role of precious metals as portfolio hedges during unstable times.
For traders, volatility remains high. For long-term investors, the move is a reminder that global risk can reshape asset prices very quickly.
Understanding these dynamics requires timely insights and disciplined execution.
How Swastika Investmart Supports Investors
Navigating volatile commodity markets is not easy without the right tools and research.
Swastika Investmart, a SEBI-registered brokerage, helps investors track global cues, commodity trends, and macro developments through robust research tools and real-time market access.
With tech-enabled trading platforms, responsive customer support, and a strong focus on investor education, Swastika Investmart enables investors to make informed decisions even during turbulent markets.
Frequently Asked Questions
Why did silver cross ₹4 lakh in India?
Silver crossed ₹4 lakh due to rising global fear triggered by US–Iran tensions, a tight US Fed stance, and a weaker dollar supporting safe-haven buying.
Is this rally driven by jewellery demand?
No, this rally is primarily driven by fear, uncertainty, and investor demand rather than jewellery consumption.
Why is silver outperforming gold?
Silver benefits from both safe-haven demand and industrial usage, along with tighter supply and momentum buying.
Can silver prices stay high from here?
As long as geopolitical tensions, policy uncertainty, and currency weakness persist, silver prices may remain elevated and volatile.
Should retail investors invest at these levels?
Investors should assess risk tolerance and consult a financial advisor before taking positions in volatile markets.
Final Takeaway
Silver crossed ₹4 lakh not because of fashion or festivals, but because fear returned to global markets.
Rising US–Iran tensions, tight monetary policy, and a weak dollar combined to push investors towards financial shelters. Gold and silver are doing exactly what they have done for centuries, protecting value when uncertainty rises.
For investors, the key is not chasing headlines, but understanding the forces behind them.
If you want to track such global market moves with clarity and confidence, consider getting started with Swastika Investmart.

CPSE ETF Mega Breakout Explained: Are PSU Stocks Entering a New Uptrend?
Key Takeaways
- CPSE ETF has broken out after nearly a year of consolidation
- Weak dollar and rising commodities are supporting PSU stocks
- Government reforms are improving PSU efficiency and profitability
- CPSE ETF offers diversified exposure to India’s top government companies
A Big Signal from the Markets
Sometimes the stock market sends quiet signals. And sometimes, it flashes a bold one. Right now, the CPSE ETF is doing the latter.
After spending almost a full year moving sideways, the CPSE ETF has delivered a decisive breakout. This is not about one PSU stock performing well. It is about an entire basket of government-owned companies showing renewed strength together.
Historically, such breakouts after long consolidation phases often mark the beginning of a broader trend. For investors tracking PSU stocks, this move deserves close attention.
What the CPSE ETF Represents
The CPSE ETF is designed to track some of India’s largest and most strategically important central public sector enterprises. These include leaders from power, energy, and financial segments such as NTPC, ONGC, PFC, and REC.
Instead of picking individual PSU stocks, the ETF allows investors to participate in the overall performance of this space through a single instrument. This diversification reduces stock-specific risk while still capturing sector-wide momentum.
The Technical Breakout Story
From a chart perspective, the CPSE ETF spent nearly a year in consolidation. Prices moved within a narrow range, frustrating short-term traders and testing the patience of long-term investors.
Such phases usually reflect uncertainty and lack of conviction. What changes the narrative is volume-backed price expansion. The recent move in CPSE ETF ticks that box.
A breakout after prolonged consolidation often suggests fresh participation from institutional investors and renewed confidence in the underlying theme.
Macro Tailwinds Supporting PSU Stocks
This breakout is not happening in isolation. Macro conditions are lining up in favour of PSU-heavy sectors.
One key factor is the weakening Dollar Index. Historically, a softer dollar benefits emerging markets like India. It also supports capital flows into sectors linked to commodities and infrastructure, where PSUs have significant exposure.
The second major driver is the global commodity upcycle. Prices of oil, metals, and energy commodities have remained firm. India’s largest commodity-linked businesses are government-owned companies. As commodity prices rise, their revenues and cash flows tend to improve, strengthening investor sentiment.
The Government Reform Angle
Perhaps the most important change is happening at the policy level.
Over the last few years, the government’s approach towards PSUs has evolved. There is a stronger focus on operational efficiency, accountability, and return on capital. Strategic disinvestment and privatisation discussions have improved discipline and transparency.
Initiatives aligned with the Atmanirbhar Bharat vision have also helped PSUs sharpen their business objectives. Many companies that were once seen as slow-moving are now reporting consistent profits, healthier balance sheets, and improved dividend payouts.
This structural shift is gradually changing how the market values PSU stocks.
Why CPSE ETF Makes Strategic Sense
For investors, the CPSE ETF offers a practical way to benefit from multiple trends at once.
It captures the commodity upcycle without betting on a single metal or energy stock. It benefits from PSU reforms without the risk of choosing the wrong company. And it aligns with India’s infrastructure and energy growth story, which remains a long-term theme.
Post-breakout, the risk-reward profile appears favourable, especially for investors with a medium to long-term horizon.
Impact on Indian Equity Markets
The renewed momentum in PSU stocks adds another layer of strength to Indian markets. When government-owned companies participate in rallies, it usually indicates broader economic confidence.
PSUs play a crucial role in power generation, fuel supply, credit flow, and infrastructure funding. Their improved performance supports economic stability and capital expenditure cycles, which eventually benefit the wider market.
Where Swastika Investmart Adds Value
Understanding thematic shifts like the CPSE ETF breakout requires more than just chart watching. It needs macro insight, sector analysis, and disciplined execution.
Swastika Investmart, a SEBI-registered brokerage, supports investors with strong research tools, sector reports, and timely market insights. Its tech-enabled platforms, responsive customer support, and focus on investor education help clients navigate opportunities like PSU revivals with confidence.
Frequently Asked Questions
What is driving the CPSE ETF breakout?
The breakout is supported by technical strength, a weakening dollar, rising commodity prices, and improved fundamentals of PSU companies.
Does this mean PSU stocks are entering a long-term uptrend?
While no trend is guaranteed, the combination of policy reforms and macro support increases the probability of sustained momentum.
Is CPSE ETF suitable for retail investors?
It can be suitable for investors seeking diversified exposure to PSU stocks, especially those aligned with commodities and infrastructure.
Which sectors dominate the CPSE ETF?
The ETF mainly includes power, energy, and financial PSUs such as NTPC, ONGC, PFC, and REC.
Should investors enter after the breakout?
Investors should evaluate risk appetite and investment horizon, and consider professional advice before taking positions.
Final Thoughts
The CPSE ETF mega breakout is more than a technical event. It reflects a deeper shift in how government-owned companies are performing and how markets are valuing them.
For investors looking to participate in India’s commodity cycle, policy reforms, and PSU revival, this space deserves attention. The key is to stay informed, disciplined, and aligned with long-term fundamentals.
If you want to explore such opportunities with research-backed insights and reliable execution, you can take the next step with Swastika Investmart.

.avif)
.avif)

.avif)